Welcome back!
In the last two parts of this series (https://www.linkedin.com/pulse/using-vald-technology-footballpart2-preseason-jump-marko-matušinskij-opdqf/?trackingId=RGOw4GYRTdahSzj2sPIbkg%3D%3D), I talked about the countermovement jump (CMJ) and other key variables that i like to check in. Now, in Part Three, I’ll share findings from a case study conducted with Women’s Football Club Dinamo. The study focuses on elite youth female players and uses VALD technology to assess jumping and strength variables.
Performance testing plays a crucial role in monitoring player development, optimizing training regimens, and preventing injuries. However, young female athletes are often underrepresented in football research. This study aimed to fill that gap by evaluating the physical performance of 12 elite youth female players from Dinamo Zagreb, while also exploring how injury history affects key performance variables.
Using VALD ForceDecks, we measured performance across key tests during preseason in January 2024, aiming to establish a baseline before competitive matches resumed. The tests included countermovement jump (CMJ), squat jump (SJ), and a hop vertical test (HJ). We also assessed isometric mid-thigh pull (IMTP) as part of the testing protocol.

To ensure safety and optimal performance, we implemented our typical warm-up routine, which involved lower-body muscle relaxation, static stretching, dynamic mobility exercises, core activation, and targeted muscle engagement. During this warm-up, we integrated jumping and force data collection using the ForceDecks, enabling us to capture valuable neuromuscular readiness data without disrupting the session flow.
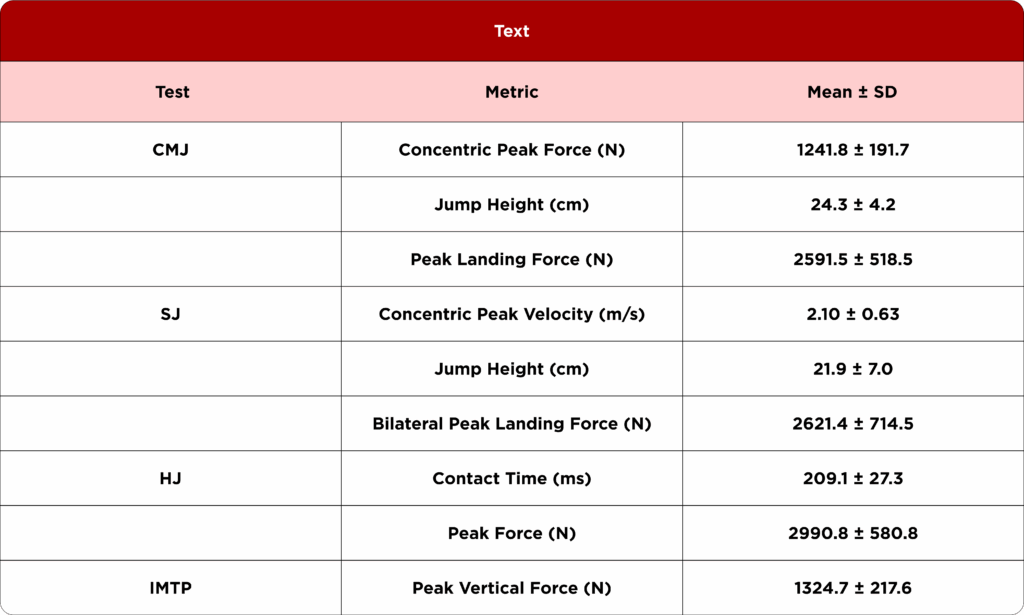
Descriptive Statistics – What Did We Measure?
Our testing focused on capturing metrics related to force production, velocity, and contact time, which are key indicators of athletic capacity. Here’s a breakdown of the results:
Correlation Analysis – Were There Any Relationships Between Tests?
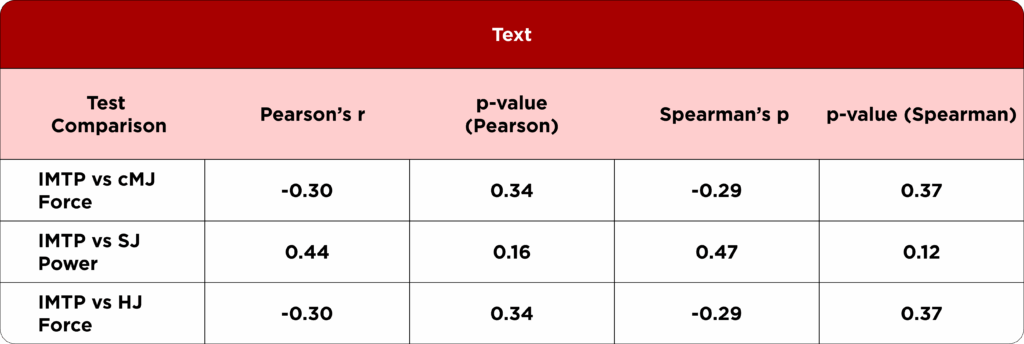
We wanted to determine if IMTP peak vertical force was correlated with other performance measures, such as CMJ, SJ, and HJ. Here’s what the correlation analysis showed:
Results Interpretation
- No Significant Correlations Found: The results revealed no statistically significant correlations between IMTP peak vertical force and other test metrics. The p-values for both Pearson’s and Spearman’s correlations were all above the significance threshold (0.05), indicating that IMTP peak force alone may not strongly predict performance in jumps or dynamic movement tests.
- Trends Worth Noting: Although not statistically significant, there was a positive trend between IMTP and squat jump power (Pearson’s r = 0.44, Spearman’s ρ = 0.47). This suggests that stronger players may have better power output in the squat jump, but more data would be needed to confirm this relationship.
- Impact of Injury History: Players with knee injuries showed lower performance in peak force and peak power, which aligns with the understanding that past injuries can hinder neuromuscular output and overall athletic performance. This highlights the need for individualized training programs to address such deficits. Knee injuries were associated with longer contact times (36.8 ms), lower peak force (156.6 N), and significantly reduced peak power (1207.8 W) in HJ tests compared to players without such injuries. RSI differences were minimal (0.12), while flight time increased by 22.8 ms among injured players.
What Do These Results Mean for Training and Development?
Besides the jumping and test results, the number and type of injuries has once again come to the forefront of my mind. I’ve been discussing for some time now that our football league is facing serious issues regarding both the prevalence and burden of injuries, especially when it comes to female football players.
As the data suggests, injuries hinder players’ performance outputs. One of the most significant findings from this study is that injuries particularly affect the rate of force development (RFD) qualities in players, which are crucial for explosive movements like jumping, sprinting, and changing direction.
What stood out even more was how some players altered their jump strategy post-injury: 🔎 During the eccentric (braking) phase, many players overloaded their non-dominant or non-injured leg. 🔎 However, during the landing phase, the opposite occurred — players tended to overload the previously injured leg.
This shift in strategy is noteworthy and raises several questions about the neuromuscular adaptations and compensatory mechanisms players develop during recovery.
Even more intriguing was what we observed when analyzing the force-time curves:
- Some players exhibited bimodal peaks during the jumping phases.
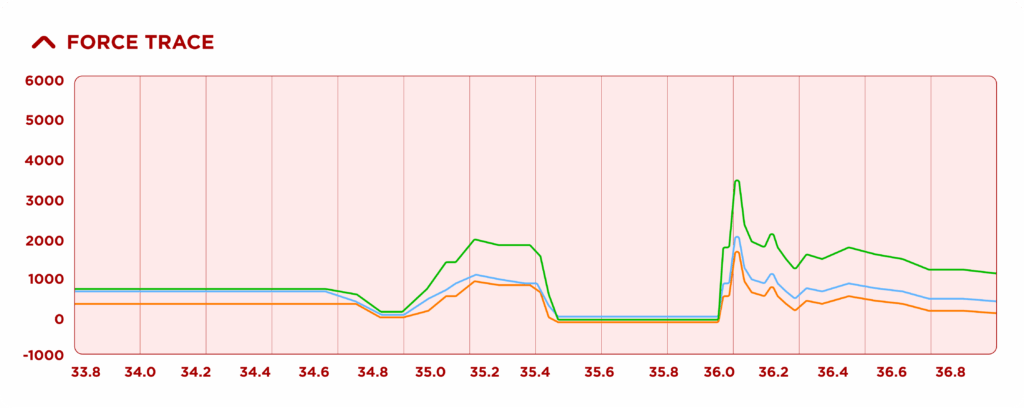
- These peaks could potentially be linked to mobility restrictions or stability issues, which might affect movement efficiency and increase injury risk.
This is definitely an area that warrants further investigation, and it’s something we plan to explore in future studies. By identifying these patterns and understanding their underlying causes, we can develop better injury prevention strategies and optimize rehabilitation protocols to ensure players return to their pre-injury performance levels.