Introduction
The football of 2030 would not be the same as the football of 2020. In recent years, the game has changed. The number and intensity of football actions have evolved. Modern teams tend to execute more counterattacks and experience greater exposure to intense, short accelerations and decelerations, interspersed with high-intensity movements. However, alongside these advancements, there has been a concerning trend: the annual increase of muscle injuries, particularly hamstring injuries, by 4%.
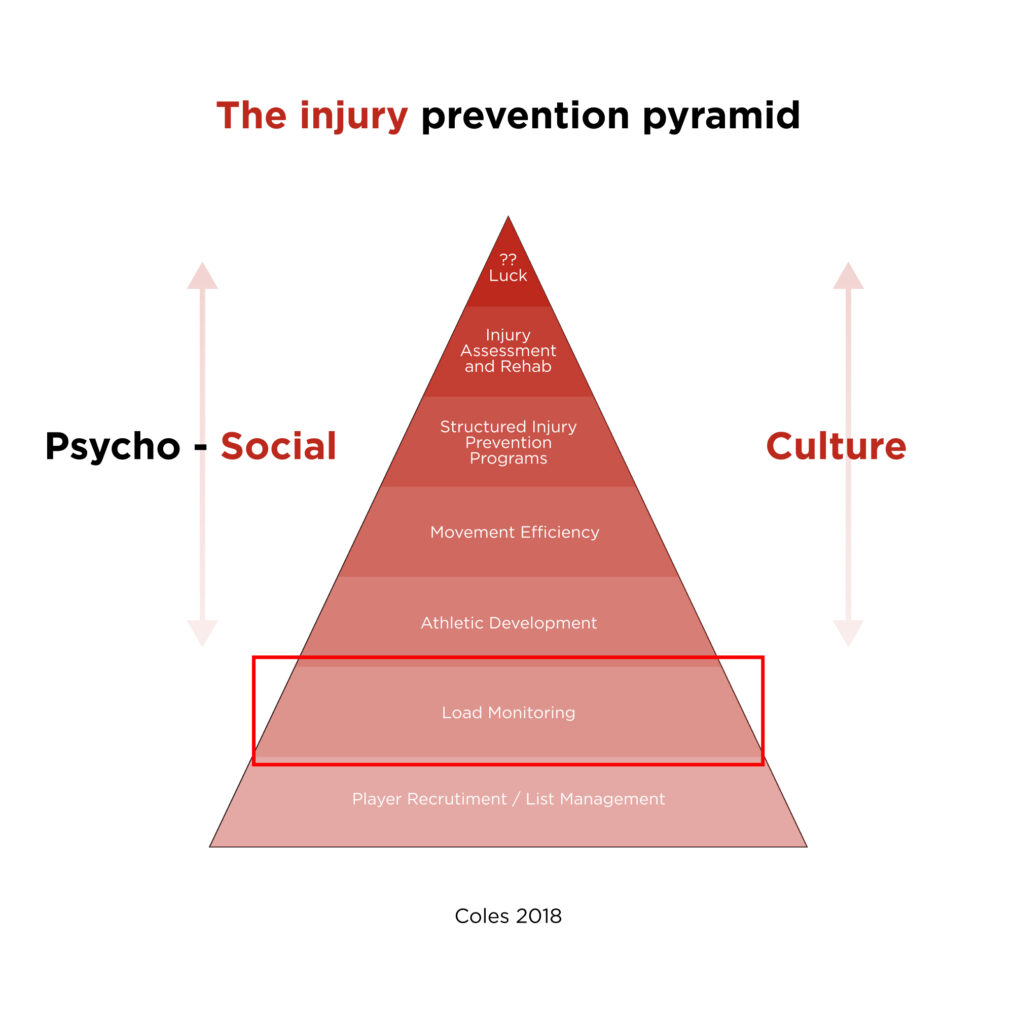
Sports injuries are becoming a widespread issue, not only in football but in many sports. Dealing with an injured athlete demands more time, money, and energy from the most important stakeholders, not to mention the athlete’s absence from practices and games. While the causes of injury and overtraining or undertraining are multifactorial, recent research suggests that poor load management may contribute to the risk of potential injury.
External Load Monitoring with ULTRAX Platform
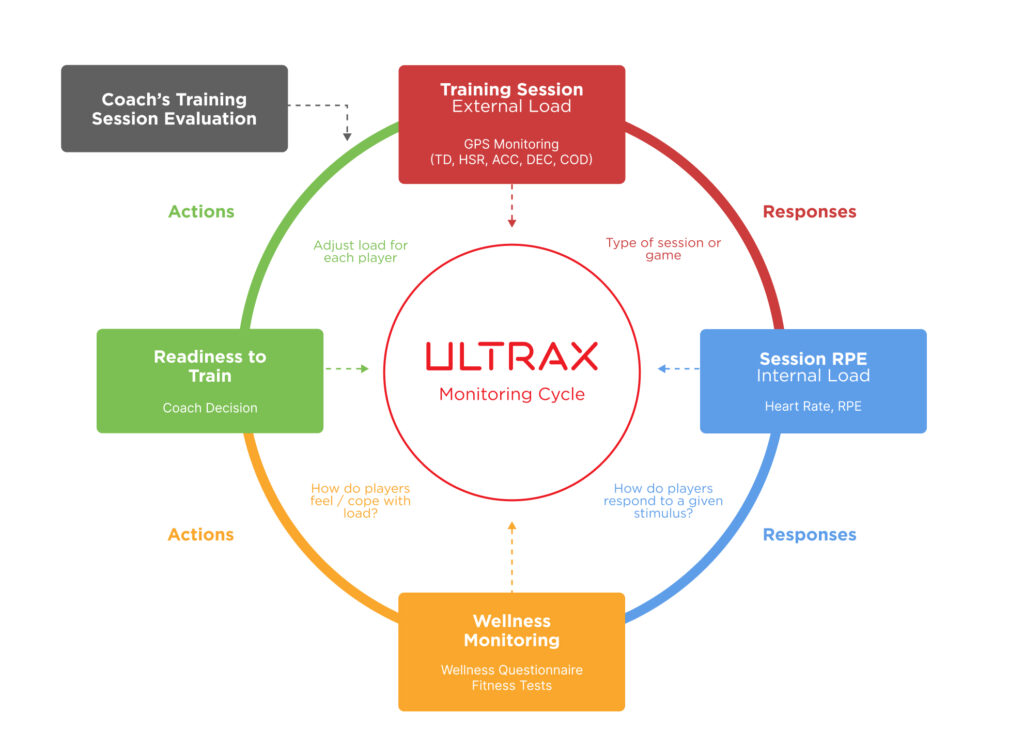
As trainers, you’ve likely encountered numerous Excel and Word files saved on your personal computer. The ULTRAX performance platform offers a solution—a comprehensive athlete and sport management software that centralizes data collection for your players or clients. Within the ULTRAX performance platform, you can gather data on both internal and external workloads of your team or players, create events such as training and competitions, and input test results. Beyond data collection, the application processes, interprets, and visualizes this information for you and your team, streamlining the management process and offering insights into optimizing performance and minimizing injury risk.
Basic Concepts
Load represents the combination of sports and non-sports stressors. This implies that an athlete’s impact isn’t solely confined to sport-related activities like training sessions and games; it also encompasses factors such as family obligations, sleep deprivation, nutritional habits, and mental state on a given day or in preceding days.
We can categorize load into two subcategories: external load and internal load. This document focuses primarily on external load factors and variables. For information on internal load variables and how to collect and analyze such data, please refer to the text about internal load variables.
Understanding External Load
For collecting external load reactions from the players, we use microtechnology sensors known as GPS units. Modern physical training in elite sport is characterized by the systematic and continuous assessment of data on competitive and training performances (Clemente et al., 2019a). In team sports, Global Positioning Systems (GPS) technology is probably the most used monitoring tool to record workloads during training and competitions (Akenhead and Nassis, 2016).
Key Factors in External Load Monitoring
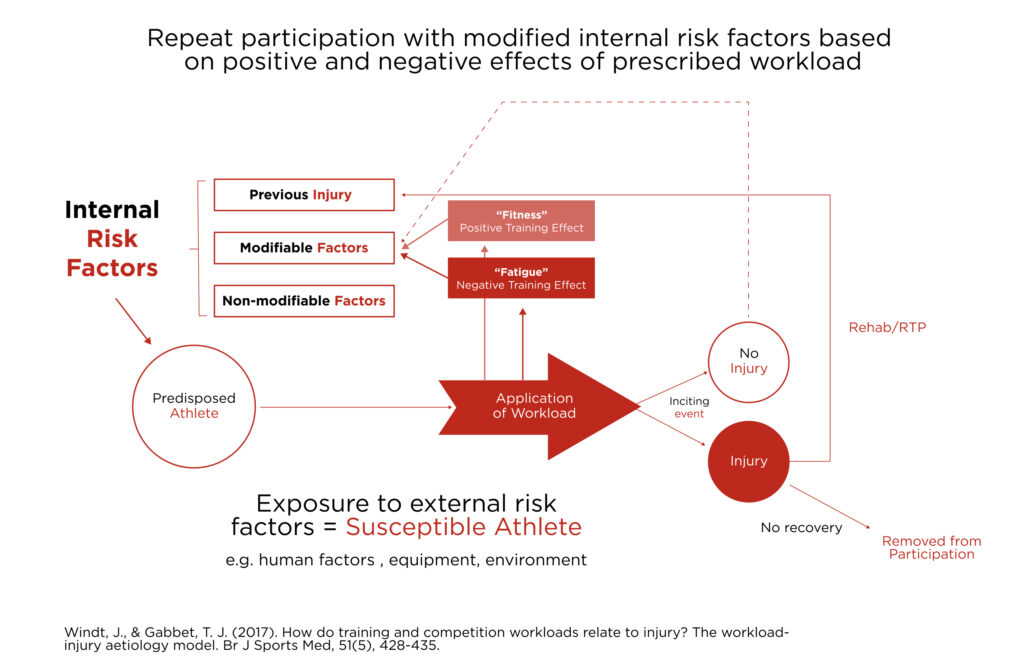
In soccer, the training load (TL) has previously been defined as the input variable that is manipulated to elicit the desired training response (Impellizzeri et al., 2019), and it can be differentiated into external and internal loads (Jaspers et al., 2017). While external TL refers to the overall activities of a player, internal TL encompasses the psycho-physiological stress imposed on the player’s body (Jaspers et al., 2017). Both internal and external TLs represent the cumulative exposure of each player to training and competitions (Jaspers et al., 2018). TL can be assessed by means of internal and external measures (Impellizzeri et al., 2019).
Understanding GPS Tracking Technology
At its most fundamental level, a GPS receiver calculates position by timing the signals emitted by GPS satellites orbiting the Earth. Simply put, each satellite continuously transmits messages containing the time of transmission and the satellite’s position at that moment. These distances and satellite locations are then used to compute the location of the receiver (unit) at a specific time point using a process known as trilateration.
While velocity and directional information are valuable for basic speed and distance calculations, some devices also incorporate multiple inertial sensors. These sensors enable practitioners to conduct more detailed levels of athlete monitoring (source: Catapult Sports).
Accelerometers
Accelerometers are particularly useful for identifying many athletic movements (e.g., jumps or tackles) and understanding large accelerations that may result in small movements.
Catapult devices use tri-axial accelerometers (up/down, forwards/backwards, and sideways) that are just a few millimeters in size, measure acceleration at 10,000 Hz, and record at 100 Hz (100 times per second).
Gyroscopes
Gyroscopes measure rotation around three axes (the coronal plane, the frontal plane, and the sagittal plane). The combination of gyroscope and accelerometer data allows us to create more precise pictures of dynamic athlete movements than would be possible with one sensor alone. By combining data in this way, GPS units are now able to facilitate far more detailed analysis of an athlete’s movement.
Catapult units contain tri-axial gyroscopes (the three axes being yaw, pitch, and roll) that collect data at 100 Hz. This is particularly useful for detecting the speed of rotation, something that can be employed to monitor how fast a shoulder rotates during a cricket delivery or baseball pitch, for example.
Magnetometers
In essence, magnetometers are electronic compasses that help to understand orientation in relation to magnetic north. In terms of athlete monitoring, magnetometers provide information regarding direction and orientation, helping practitioners to understand the volume of key movements such as changes of direction.
Relevant Parameters from Global Positioning System Data
The selection of relevant GPS parameters depends on the intended use. GPS parameters are useful for monitoring external TL (e.g., planning external TL, calculating the ACWR), both individually and collectively, to create specific training sessions and analyze their level of specificity (Dellal et al., 2012). Based on scientific evidence, the total distance covered, the distance covered at high-speed running (HSR) measured between 19.8 and 24.8 km/h, the distance covered at sprint running (SPR) measured over 25.2 km/h, the specific maximal speed (recorded in the game), the number of accelerations (≥3 m/s²), and the number of decelerations (≤ -3 m/s²) seem to be relevant GPS parameters for monitoring external TL in professional soccer (Akenhead et al., 2016; Varley et al., 2017).
All these GPS parameters represent the volume of training sessions and games (Figueiredo et al., 2018). Total distance covered, high-speed running, or sprint running related to time (expressed in “m/min”) reflect intensity and are used to design specific training sessions [e.g., rehabilitation sessions (Taberner et al., 2019)] and to delineate their specificity (e.g., physical activity profile similar to the game; Figueiredo et al., 2018; Whitehead et al., 2018). Additionally, the distance of high-speed running efforts (i.e., sprints, accelerations, and decelerations) characterizes the specifics of the game or the training session (Martín-García et al., 2018). For these GPS parameters, the average, the minimum, and the maximum values should be considered for analyses (Rago et al., 2019b) (Rave et al., 2020).
Variables in Sports Monitoring
When dealing with a large amount of data, it is necessary to define which variables will best suit its environment. Strength and conditioning coaches or physical coaches who work in a team environment should, together with their staff members, define which variables they are interested in, taking into account the culture of the environment, the demands of the sport, the reaction of the players to that sport, the studied literature, and the systems used (Catapult, STATsports, Fieldwiz).
In general, the most recognized variables used in sports are training duration, total distance during training, distance covered in certain speed zones, high-intensity movement over 19.8 km/h, distance covered by sprinting over 25.2 km/h. Likewise, the total number of accelerations and decelerations and their categorization in certain zones.
Experts also know how to use different percentages and relationships between variables, so there you can find the total percentage of movement in the high-intensity movement zone and the sprint zone in relation to the total distance. Achieving the maximum sprint speed or being in the zone over 90% of the maximum movement speed of the players is considered an important data in the training programming process. Players who have not been in the mentioned zone for some time, according to research, may be at risk that the next time they reach that zone, they may suffer some muscle injury.
What is also important to mention is that sometimes when interpreting the data, the systems do not have the same precision or variable interpretation. Some of the devices can have 5, some 10 or 15Hz. This is important to mention because the units with 5Hz are not so accurate in detecting high-speed running values. Also, some systems use high-speed running in zones above 21 km/h while others use speed threshold above 19.8 km/h. Sport professionals must be aware of this information.
Ultrax Platform Integration
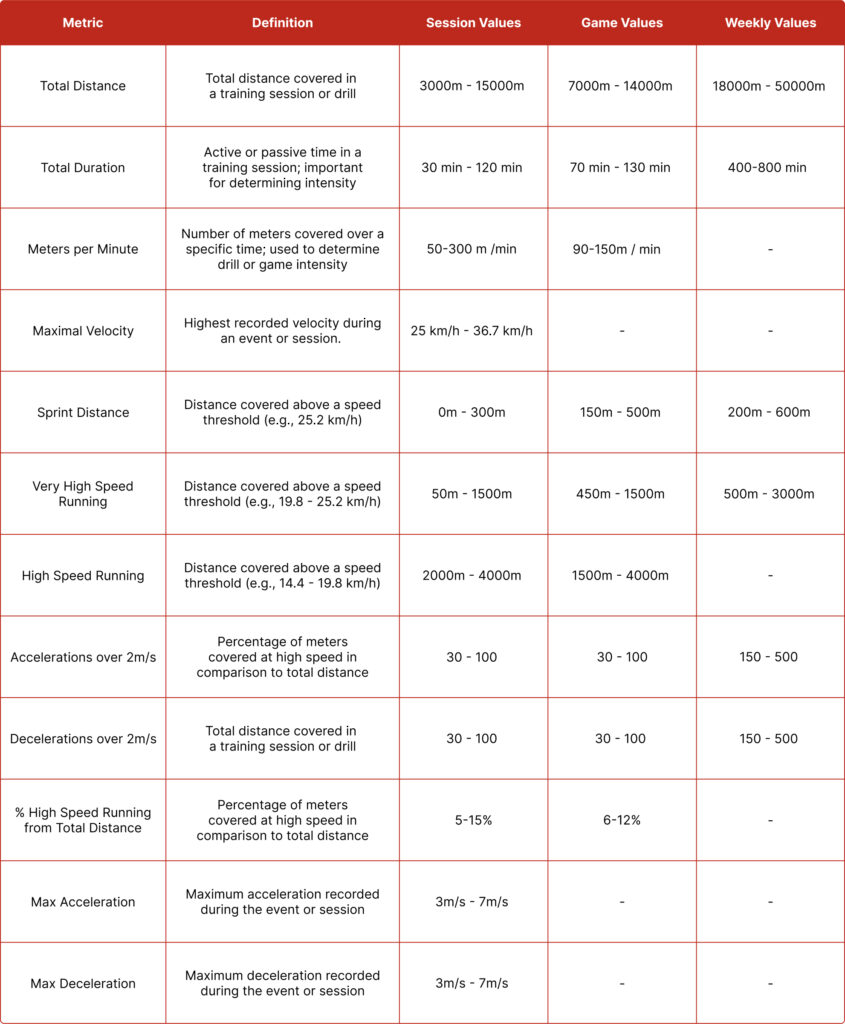
The Ultrax platform can integrate CSV data and connect through API link with third parties. This way, external and internal load variables can be found in one place, and you can combine them to get a clearer picture of the total load of your player or team. The variables used in our system depend on the system you are using, but we will list some of them together with their descriptions in the table below.
The possibility of connecting several systems and the possibility of connecting internal and external loads in one place also offers the possibility of complete control of the load and reactions of your players. Let’s say that in your club you use one system for monitoring the external load, which is the Catapult system, while your players use Statsport when they go to national gatherings in their national teams. Without such a platform, the ability to connect data is complicated and sometimes unavailable.
Making Sense of the GPS Data
After you collect the data, you need to decide what to do with it. Usually, in performance settings, team staff members create team session reports, team game reports, individual game reports, and individual session reports as the most useful information you want to present to your coaches and athletes (sport scientists and data scientists go even deeper).
Team Session Report
In a team session report, you want to see how athletes have responded to the given load. You examine how much distance they have covered in a given time or how much high-intensity work they have performed. Additionally, it’s important when interpreting team session external variables to compare who has worked the most and who has performed less work at the same time. In some sessions, you may want your athletes to collect fewer accelerations or decelerations of high intensity, but in scenarios like small-sided conditioning games, you want to see all your athletes giving their maximum effort.
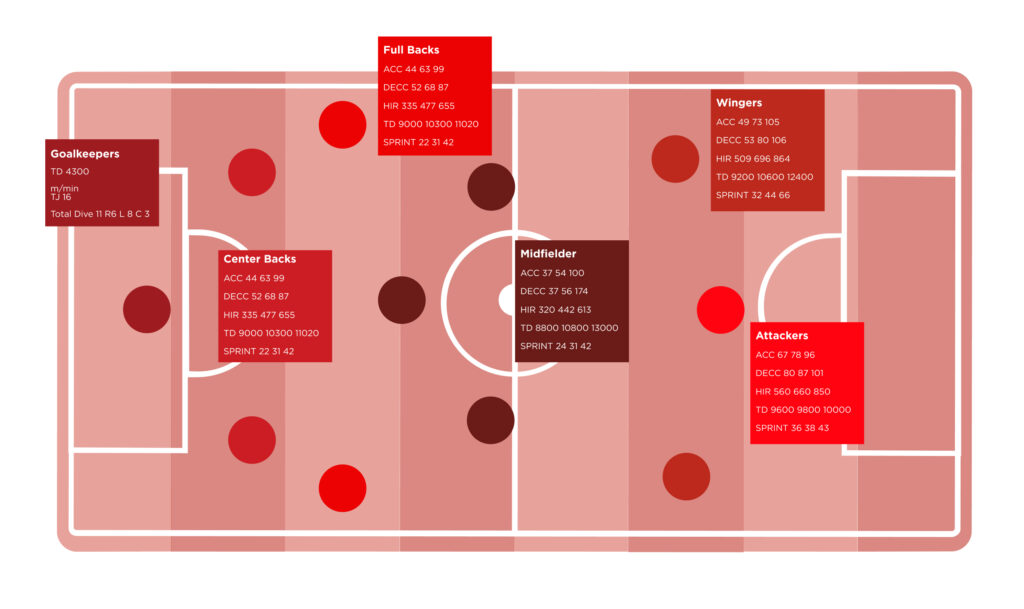
Player Positions
As we all know, in football, we have different positions. This means that during the game, players work and perform differently. Midfielders will cover more total distance when compared with central defenders but will have less high-speed running or sprinting distance compared to fullbacks and wingers. Therefore, when interpreting the external load data, we need to take the demands of each position into account.
We can then use the game data to program training sessions according to the game demands for the whole team and for each position. Team session reports can help us interpret the impact of the training session on the player if we know their weaknesses and strengths and how intense the training sessions were when comparing the values with game demands.
Team Game Report and Individual Game Report
In the game report, you can find the same variables as in the training session report. You’ll want to see how your team has performed in a game, but do not forget that context is key, especially when interpreting the external load data from the game. Depending on the tactical demands of our team or opponent, we can see different values when we are in one style of play. We can compare our team values, compare our positions on the left and the right side or use 2- or 5-minute periods and track them during the whole game so that we can see what is happening with the volume or intensity of the team or individual.
Also, when interpreting the game data, maybe you will want to compare the first and second half performance. This way, we can see if we have increased or decreased intensity or volume according to situations on the pitch. In team or individual game reports, you want to use minimal, maximal value, average value, and percentages.
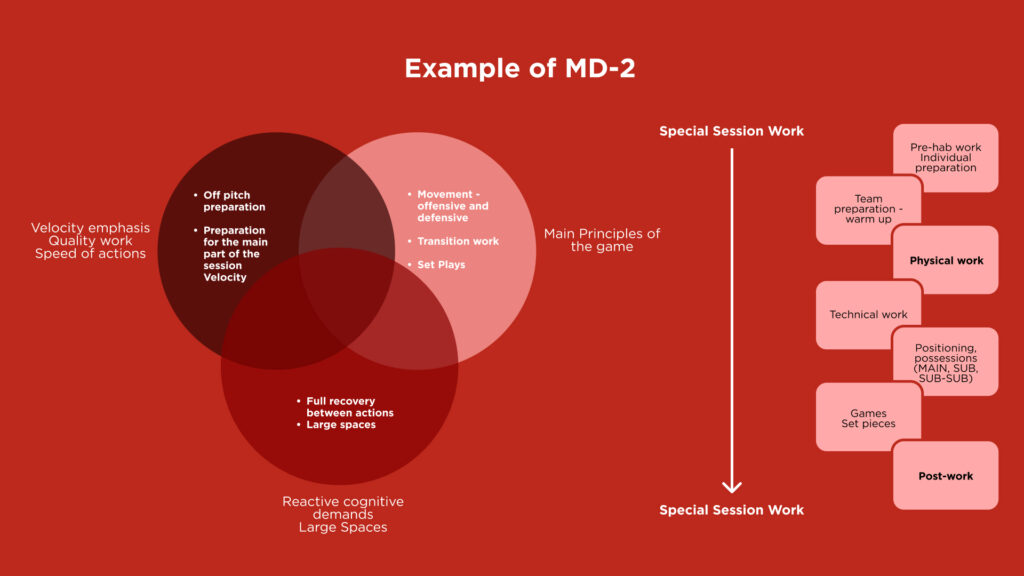
Match Day – 2: Training Prep
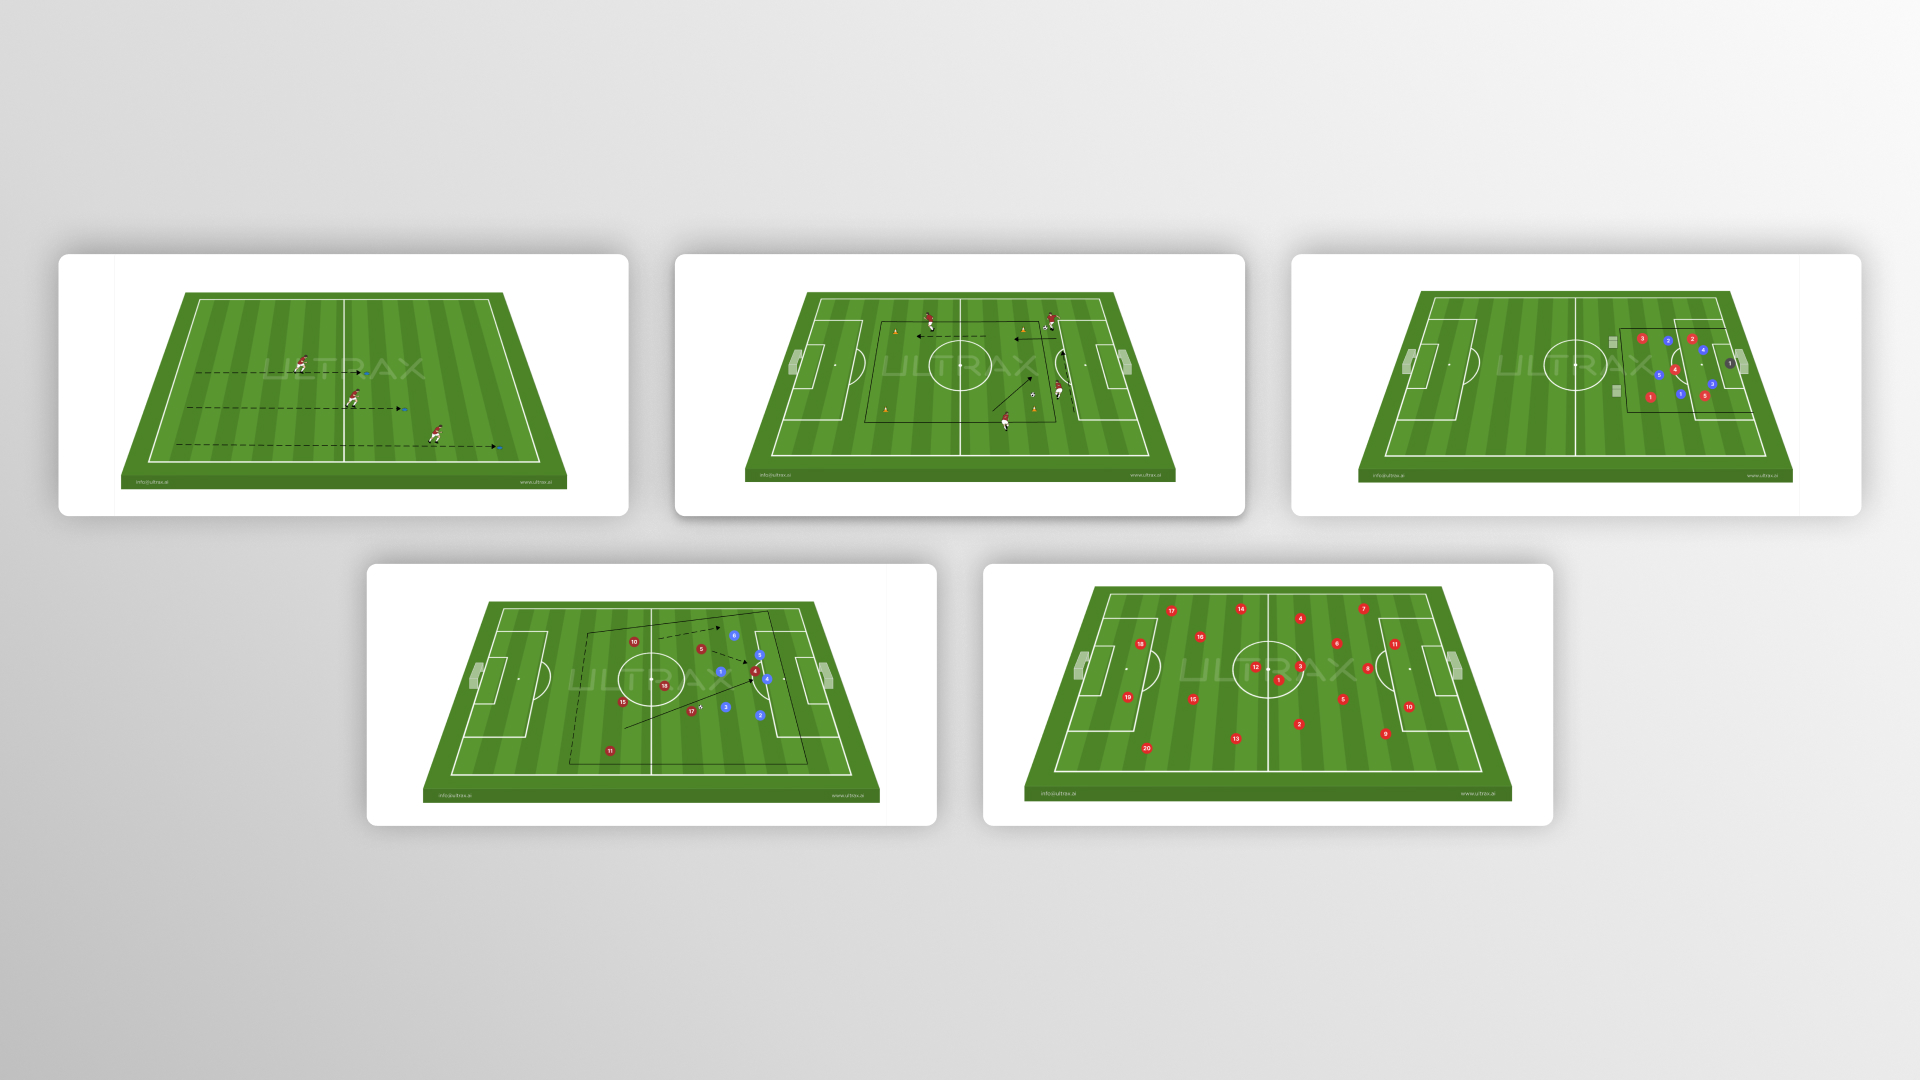
Let’s take the example of MD-2, or two days before the match. Usually, the emphasis and goal of this day are of a technical-tactical nature, and the contents that coaches typically use include various forms of finishing drills, tactical exercises aimed at adopting tactical ideas, and usually end with a large-sided game.
Tracking this type of training session with GPS equipment for several weeks allows us to understand the demands placed on the players’ bodies. We know that in this type of training session, there will be some sprint values, and that the hamstrings will be working in some form of eccentric work, while the quadriceps will work concentrically due to the number of strikes and accelerations. Having established this through previous weeks, we know that we need to prepare this musculature before stepping onto the field, so we need some “priming” exercises to prepare them for the first drill in training.
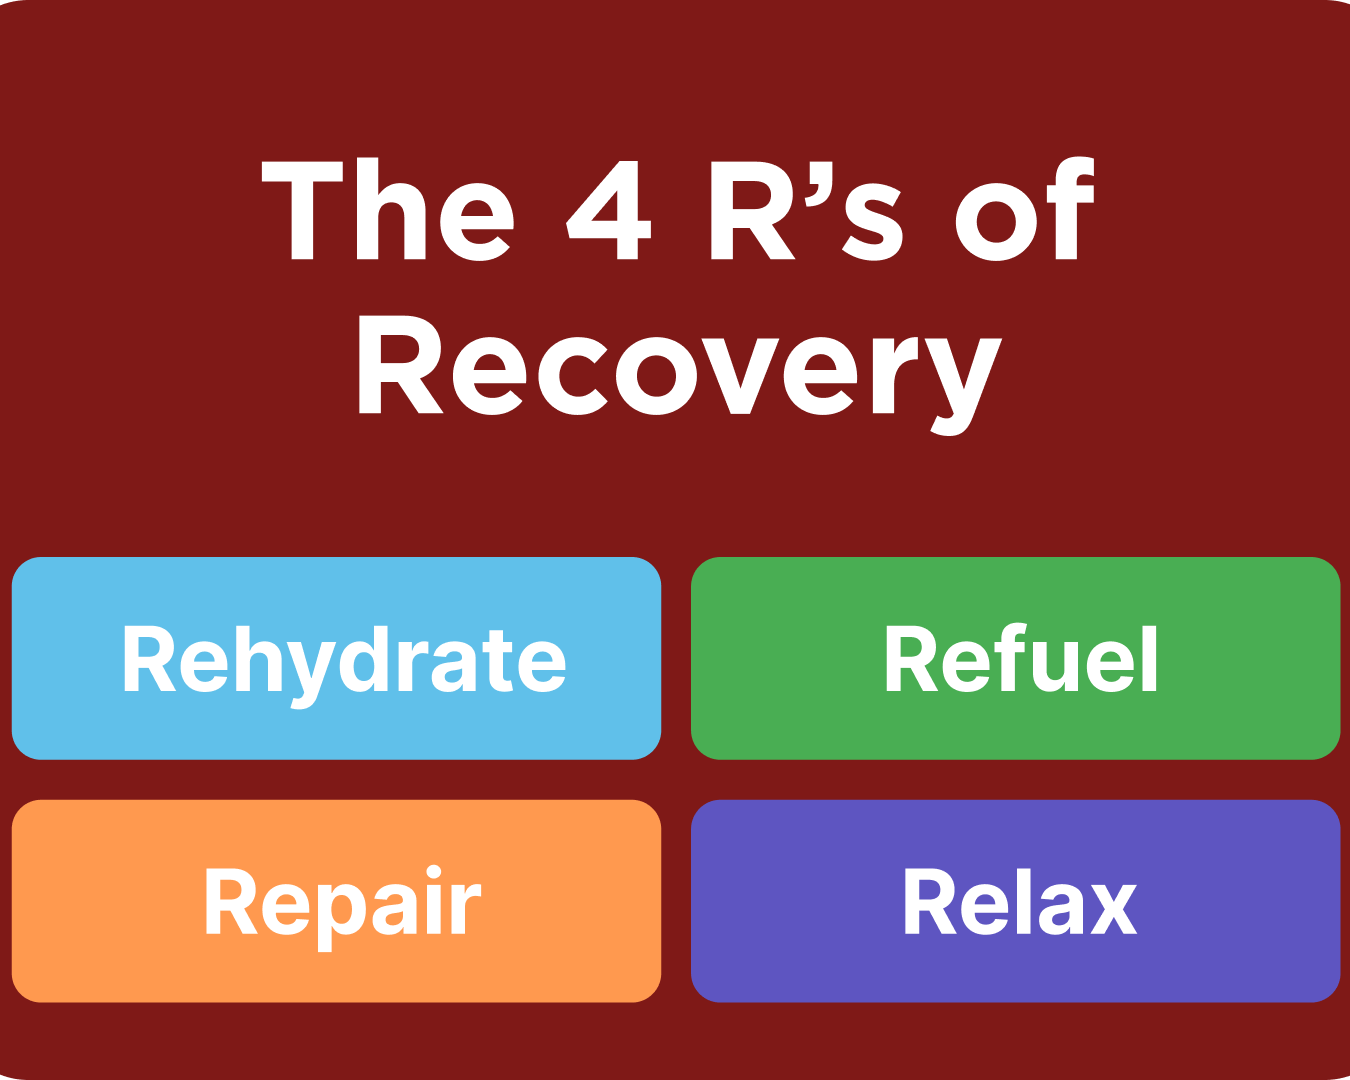
After the session, we can already plan the recovery methods we will use because we know that a training session of this nature will elicit higher values in high-intensity running and sprinting than perhaps another day in the week.
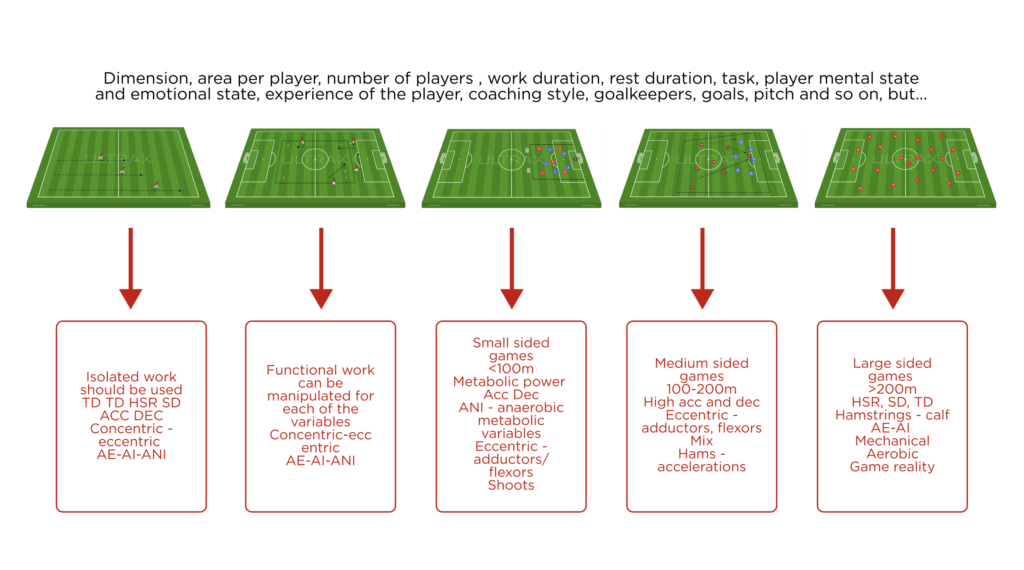
Player Profile and Training Structure
In addition to defining a player’s profile with GPS technology based on their actions during training or matches, as seen in the example above, we can also define typical structures of days that may occur within the week. Furthermore, creating your own database of drills or your coach’s database can be an excellent part of the whole process. Apart from the coach’s character, which can influence the outcome of the numbers with their energy, the dimensions of the field, and the number of players also play a significant role in training intensity. Considering these factors, we can differentiate between drills focusing on isolated work, functional work (connected to technical elements), small-sided games, medium-sized games, and large-sided games.
Final Thoughts
The implications of effectively managing external training loads through GPS technology are profound. By harnessing this sophisticated tool, coaches and fitness professionals can tailor training regimens that optimize performance while minimizing injury risk. It’s a strategic asset that turns data into actionable insights.
Real-World Example
Imagine a scenario where a soccer team is preparing for a critical match. A staff member notices that a key midfielder’s performance metrics have been declining. The player’s total distance and high-speed running values have decreased, and his acceleration rates are not as sharp as before.
Through analysis, it becomes apparent that the player’s acute training load has been consistently high without adequate recovery periods, leading to fatigue. The coach decides to implement a tailored recovery protocol, including modified training sessions focusing on technical skills with reduced intensity and additional rest days.
In the following weeks, the data reflects a positive trend. The midfielder’s performance metrics improve, demonstrating increased distances covered and better acceleration patterns.
It’s clear that GPS technology is no longer a luxury but a necessity in modern sports. Embracing and utilizing it in our daily routines can lead to significant improvements in athlete performance and well-being.
References
- Akenhead, R., & Nassis, G.P. (2016). Training load and player monitoring in high-level football: current practice and perceptions. International Journal of Sports Physiology and Performance, 11(5), 587-593. Available at: https://journals.humankinetics.com/view/journals/ijspp/11/5/article-p587.xml
- Impellizzeri, F.M., Marcora, S.M., et al. (2019). Internal and external training load: 15 years on. International Journal of Sports Physiology and Performance, 14(2), 270-273. Available at: https://journals.humankinetics.com/downloadpdf/view/journals/ijspp/14/2/article-p270.pdf