

This paper effectively summarizes key aspects of sprinting in football, offering valuable insights into periodization strategies, monitoring sprinting, and defining appropriate dosage. One of the highlights is the mention of MD-2 as the “most tactical” and “speed” day of the week. However, as the authors point out, the accumulated load from MD-4 and MD-3 can negatively impact a player’s performance and potentially increase the risk of injury on MD-2.
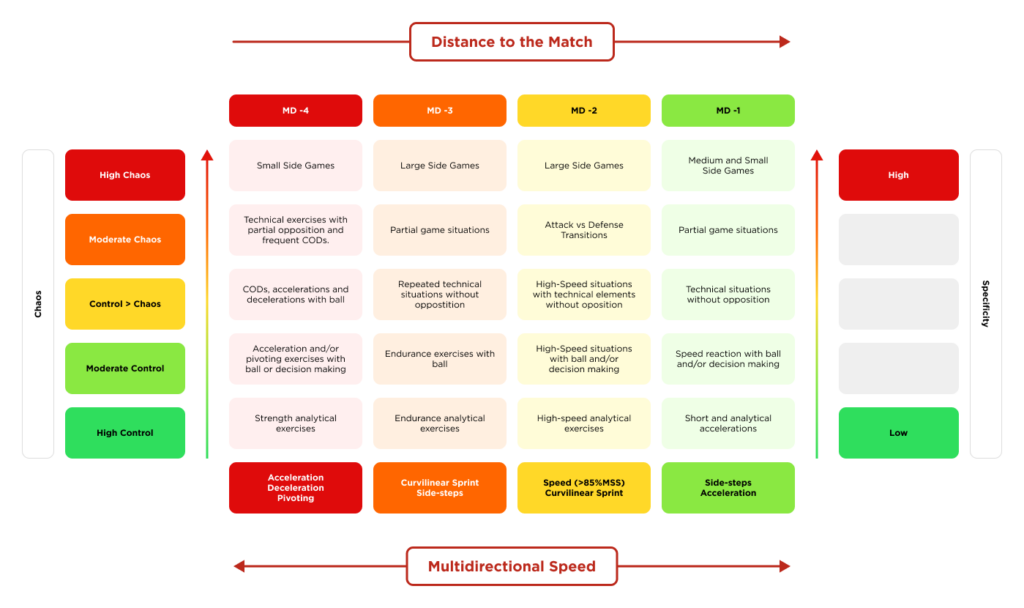
When defining a player’s reaction to this load and its impact, we need to consider the player’s “battery” – their physical state on that day. It’s crucial to understand both the game demands and position-specific demands for that player, as the study emphasizes. Knowing the acute and chronic loads the player is exposed to is paramount. Between these two categories, training sessions and drills selected by coaches play a key role in developing or addressing game situations. In Croatia, it’s common to place significant focus on tactical actions on MD-2, but we must also consider how to best use the first day of the week and other training days to provoke adaptations and simulate game demands. While the total number of sprints and distances covered in specific speed zones are valuable, I have always been more interested in the distribution of these actions and the specific situations in which they occur. It’s important to examine the frequency of these actions and how often they happen during games. Furthermore, I want to understand what kind of actions precede these high-intensity efforts and the movements players make before transitioning into them.
One Game Scenario
Overview of Key Metrics:
- Average Sprint Distance: 93.72 meters – This is the average distance covered by the players in sprinting zones (Zone 5).
- Average HSR (High-Speed Running) Distance: 379.6 meters – The average distance players covered in high-speed running.
- Intensity: 7.08 – This value likely reflects the intensity of the match, calculated from factors such as distance, speed, and workload.
Selected Player Data:
Below are the metrics collected for individual players based on the selected variables in the dashboard.
Player 1:
- Total Distance: 7848.05 meters
- Total Duration: 90.48 minutes
- Sprint Distance (Zone 5): 231.45 meters
- HSR Distance (Zone 4): 604.89 meters
- Meters per minute: 84.39 m/min
- Max Velocity: 31.57 km/h
- Accelerations (Zone 4): 8
- Decelerations (Zone 4): 26
Player 2:
- Total Distance: 10783.96 meters
- Total Duration: 108.68 minutes
- Sprint Distance (Zone 5): 201.7 meters
- HSR Distance (Zone 4): 653.36 meters
- Meters per minute: 93.77 m/min
- Max Velocity: 29.88 km/h
- Accelerations (Zone 4): 2
- Decelerations (Zone 4): 7
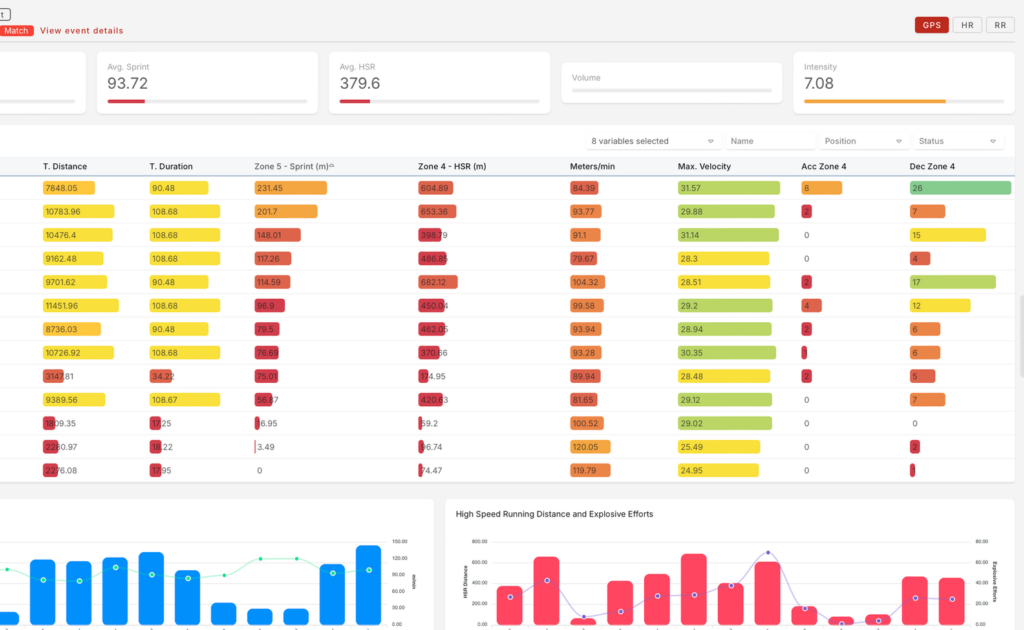
As you can see, when we compare the frequency of actions and the total volume in individual variables, player 1 and player 2 are very similar in most aspects. Both players have comparable values in terms of total distance, sprint distance, and high-speed running distance. However, there is a noticeable difference in the number of high-intensity accelerations and decelerations, where player 1 has significantly more of these actions compared to player 2. This suggests that while their overall physical output during the match is similar, player 1 was involved in more intense stop-start actions, which could indicate a difference in their roles or positioning on the field.
Let’s take it a step further and analyze what happens with these two players in the raw data. It is already visually apparent that these activities are distributed differently throughout the match. However, to avoid complexity with graphs, I will attempt to present this in a table format with values in the next display.
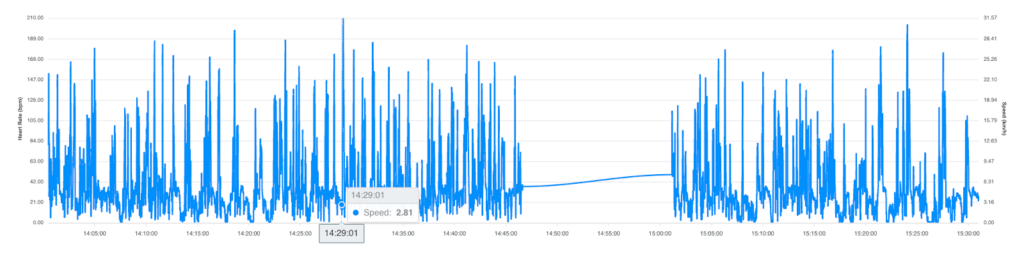
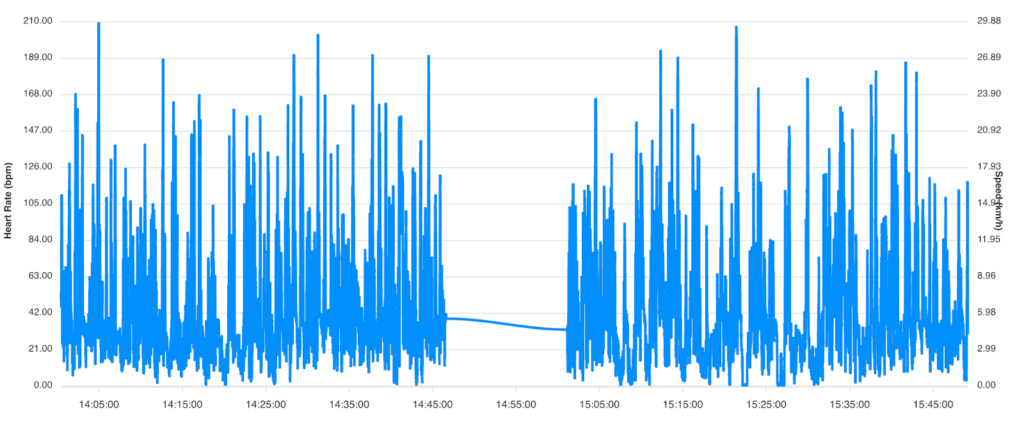
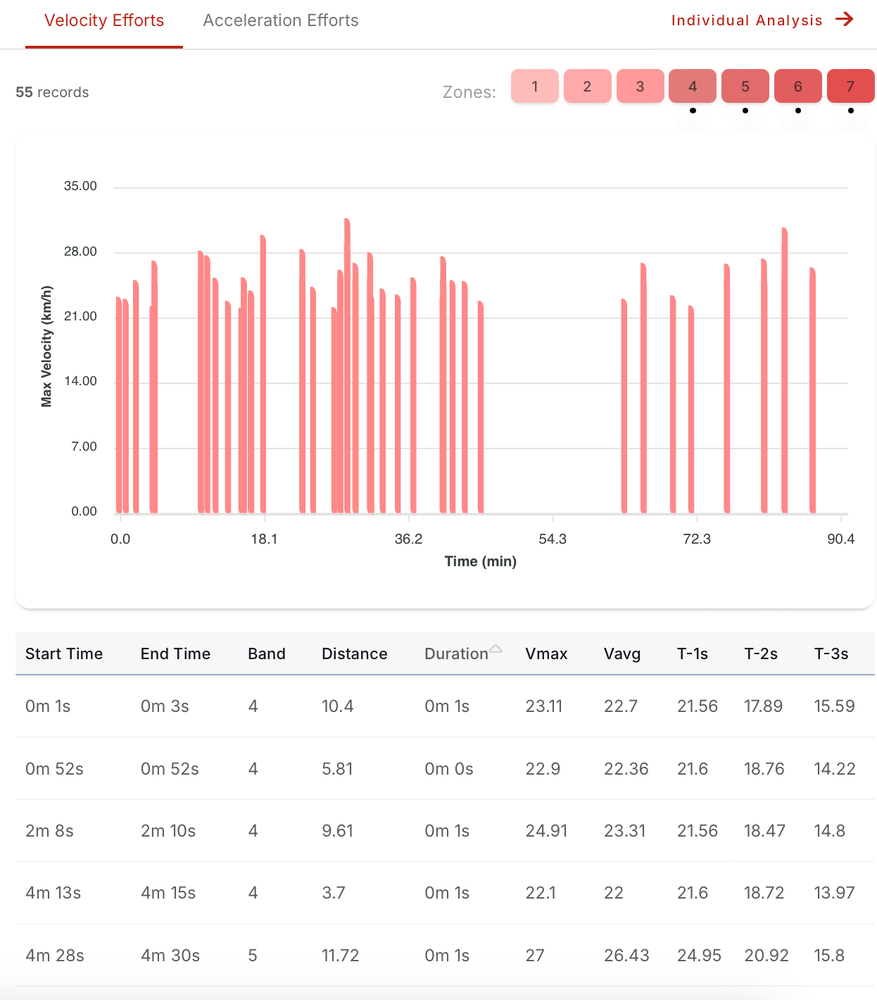
To analyze the frequency of actions, duration, and distance covered, along with the profiles of Player 1 and Player 2, let’s break it down into several key components (have in mind, I just took first 15 minutes of the match and efforts above 19.8km/h):
1. Frequency of Actions
The frequency of actions refers to how often high-speed or sprint efforts occurred for each player during the match. Both players have their efforts spread across different times, as shown by the Start Time and End Time columns.
For Player 1:
- The high-speed actions are relatively frequent, with intervals between efforts typically ranging from a few seconds to several minutes.
- Example: Between 4m 28s and 10m 16s, there is approximately a 6-minute gap, showing a recovery or rest period between those high-speed efforts. In contrast, between 12m 13s and 13m 28s, the gap is shorter (about 1 minute).
For Player 2:
- Similarly, Player 2 has frequent actions, but the intervals between efforts vary slightly more, with some actions happening back-to-back within seconds and others spaced by several minutes.
- Example: Between 4m 28s and 12m 11s, there is a nearly 8-minute gap, but between 12m 13s and 12m 15s, actions occur within just 2 seconds.
2. Duration of Actions
Both players have high-intensity actions that mostly last for 1 second (with some very brief bursts measured as 0.5 seconds).
For Player 1:
- Actions typically last 1 second (e.g., Vmax of 29.88 km/h over a duration of 0m 1s).
- Some efforts are exceptionally brief, lasting only 0 seconds, which likely represents very sharp bursts of speed that are difficult to measure at longer intervals.
For Player 2:
- Similarly, most actions last 1 second, showing that Player 2 also performs short, sharp sprints (e.g., Vmax of 28.8 km/h over 0m 1s).
3. Distance Covered
The distance covered in each high-speed action is crucial for understanding the intensity of the efforts.
For Player 1:
- Distance ranges from 3.68 meters to 16.69 meters during high-speed efforts.Example: At 4m 28s, Player 1 covers 11.31 meters with a Vmax of 29.88 km/h.
For Player 2:
- Distance varies from 3.68 meters to 11.99 meters.Example: At 4m 28s, Player 2 covers 7.88 meters with a Vmax of 28.8 km/h.
This suggests that Player 1 covers slightly more distance per effort on average, especially in the higher velocity zones.
4. Profile Before Reaching Max Velocity (T-1s, T-2s, T-3s)
The columns T-1s, T-2s, and T-3s represent the velocity in the 1, 2, and 3 seconds leading up to the max velocity. This helps show how quickly players accelerate before hitting their peak speed.
For Player 1:
- T-1s (1 second before max velocity) values are typically around 21-26 km/h, suggesting a gradual acceleration.Example: At 4m 28s, T-1s is 28.8 km/h, which shows a very steep acceleration just before hitting Vmax.
- T-2s and T-3s are slightly lower, typically in the range of 16-20 km/h, indicating a smooth buildup of speed.
For Player 2:
- T-1s values are similar, usually around 21-27 km/h, with more consistent accelerations across efforts.Example: At 4m 28s, T-1s is 29.88 km/h, showing a rapid buildup right before the sprint.
This suggests both players have similar acceleration profiles, but Player 1 may engage in sharper increases in speed before hitting their max velocity in certain efforts.
5. Recovery Durations Between Actions
Recovery durations (the time between high-speed efforts) are critical to understanding how players are distributed across phases of activity.
For Player 1:
- Recovery between actions varies significantly, with rest periods ranging from 1 second to 8 minutes.Example: The gap between 4m 28s and 10m 16s is around 6 minutes, indicating a prolonged rest after a burst of sprinting.
For Player 2:
- Similarly, the recovery periods vary from a few seconds to several minutes.Example: Between 4m 28s and 12m 11s, there is a nearly 8-minute gap.
6. Defining the Profile or Coefficient of Activity
We can define a sprint-to-recovery coefficient to represent the ratio of sprint efforts to recovery time. This will give us an idea of how often a player engages in high-intensity actions relative to their recovery.
For Player 1:
- With 54 records of efforts, and assuming an average match time of around 90 minutes, Player 1 performs a high-speed effort approximately every 1.67 minutes (or once every 100 seconds).
- However, the wide variability in recovery time (from seconds to minutes) suggests a mixed sprint profile, with some periods of intense back-to-back sprints and others of prolonged recovery.
For Player 2:
- With 55 records, Player 2 performs a high-speed effort roughly every 1.64 minutes, similar to Player 1.
- The distribution of recovery periods is also varied, but Player 2 tends to perform slightly more frequent but shorter sprints, with more consistent recovery times.
To summarize, Player 1 seems to play a role that requires intense, sustained high-speed efforts with occasional long recovery periods, while Player 2 demonstrates a more consistent sprint profile, engaging in shorter sprints with more balanced recovery times. The sprint-to-recovery coefficient for both players is similar, but the nature of their high-speed actions suggests different tactical responsibilities on the field. In part 2 we will talk about why this frequency analysis is important and how to program training sessions for these demands.