


Introduction: Why Jumps Tell a Bigger Story
In football, explosive power and braking ability are two of the most decisive qualities a player can possess. Whether it’s a winger exploding past a defender or a midfielder slamming the brakes to stop a counterattack, these movements rely heavily on neuromuscular qualities.
The countermovement jump (CMJ) has become more than just a “jump test.” With modern force plates, CMJ profiling allows coaches to break performance into phases, how effectively an athlete absorbs force during landing (eccentric phase) and how explosively they turn that into propulsion (concentric phase).
By quantifying these qualities with concentric impulse (CI) i eccentric rate of force development (ERFD), we can build a two-dimensional profile that paints a clear picture of strengths, weaknesses, and development priorities (one way of doing it).
What’s great about using force plates is that we can now see not only how players respond during jumps, but also how they react in strength training, specifically across different set and rep schemes. This provides a much deeper layer of insight into neuromuscular responses and fatigue patterns.
In one of our earlier articles, we discussed Christian Thibaudeau’s method of strength training, and we provided an example of how it could be adapted to football and a team environment (you can read it here: Profiling Senior Soccer Players Using the Quadrant Model).
Just yesterday, the team played a classic 5v5 game. The intensity was high, and it turned into a really competitive match. Afterward, I decided to add short interval runs on top of the game load, and honestly, the reaction was bad. That experience left me asking an important question: Will this extra session actually improve future performance?
Or would I gain more benefit if I performed this type of stimulus on another day when they were fresher?
This, in our opinion, is a crucial question and exactly the kind of direction where our research should go. With technologies like force plates, we can now start answering it more precisely, by tracking how players respond to training loads in real time, rather than relying only on intuition or tradition.
To return to the main topic of this blog, we tested Croatian Second League players and compared their results with Premier League standards using VALD’s 2024/25 dataset. Our aim was to see exactly where our players stand when measured against one of the highest benchmarks in world football.
Pre-Season Context
If there’s one period where testing makes the most sense, it’s the pre-season. Players come back fresh from the off-season, legs aren’t weighed down by accumulated fatigue, and those small knocks that appear during a long season are usually gone. What we get is the cleanest possible snapshot of their physical profile.
Pre-season is also the moment when we can set real baselines. It’s the starting point from which all future changes , good or bad can be measured. Later in the year, numbers are always influenced by match load, recovery status, or ongoing injuries. But in pre-season, we get the athlete in their raw state, which makes it the best time to understand where they actually stand.
At the same time, the opening weeks are not only about testing. They’re about balancing diagnostics with preparation, mixing gym work, conditioning, tactical sessions, and match exposure. The schedule sets the tone for the months ahead, and the data we collect in this period helps shape how we manage players through the rest of the season.
Training Week Structure
Weekly Cycle: High–Low Approach
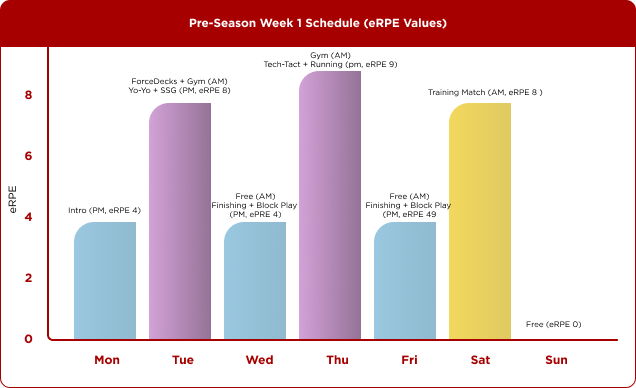
The opening week followed a high–low structure, which helped us manage intensity while still covering all key areas of preparation. The rhythm was simple: one lighter day, followed by a double session, then back to one session, then another double, and so on.
- Monday: single evening session to ease players back in.
- Tuesday: double load, ForceDecks testing and gym in the morning, Yo-Yo and small-sided games in the evening.
- Wednesday: lighter again, with only an evening tactical session.
- Thursday: another double, gym in the morning and a demanding technical–tactical session with running in the evening.
- Friday: lighter, just one evening tactical finishing session.
- Saturday: high day again with a training match.
- Sunday: complete rest.
This alternating structure gave us hard days with real loading followed by easier days for recovery and technical focus. It’s a simple but effective way to build volume in pre-season without pushing players into early overload.
Week 1 (Pre-Season Opening Microcycle):
Monday
- Evening: Intro session (eRPE: 4)
Tuesday
- Morning: ForceDecks testing + gym session
- Evening: Yo-Yo test + small-sided game (eRPE: 8)
Wednesday
- Morning: Free
- Evening: Tactical build-up and pressing (eRPE: 4)
Thursday
- Morning: Gym
- Evening: Technical–tactical drills with running (eRPE: 9)
Friday
- Morning: Free
- Evening: Tactical finishing and block play (eRPE: 4)
Saturday
- Morning: Training match (eRPE: 8)
Sunday
- Free (eRPE: 0)
The Testing Group: Establishing a Clear Baseline
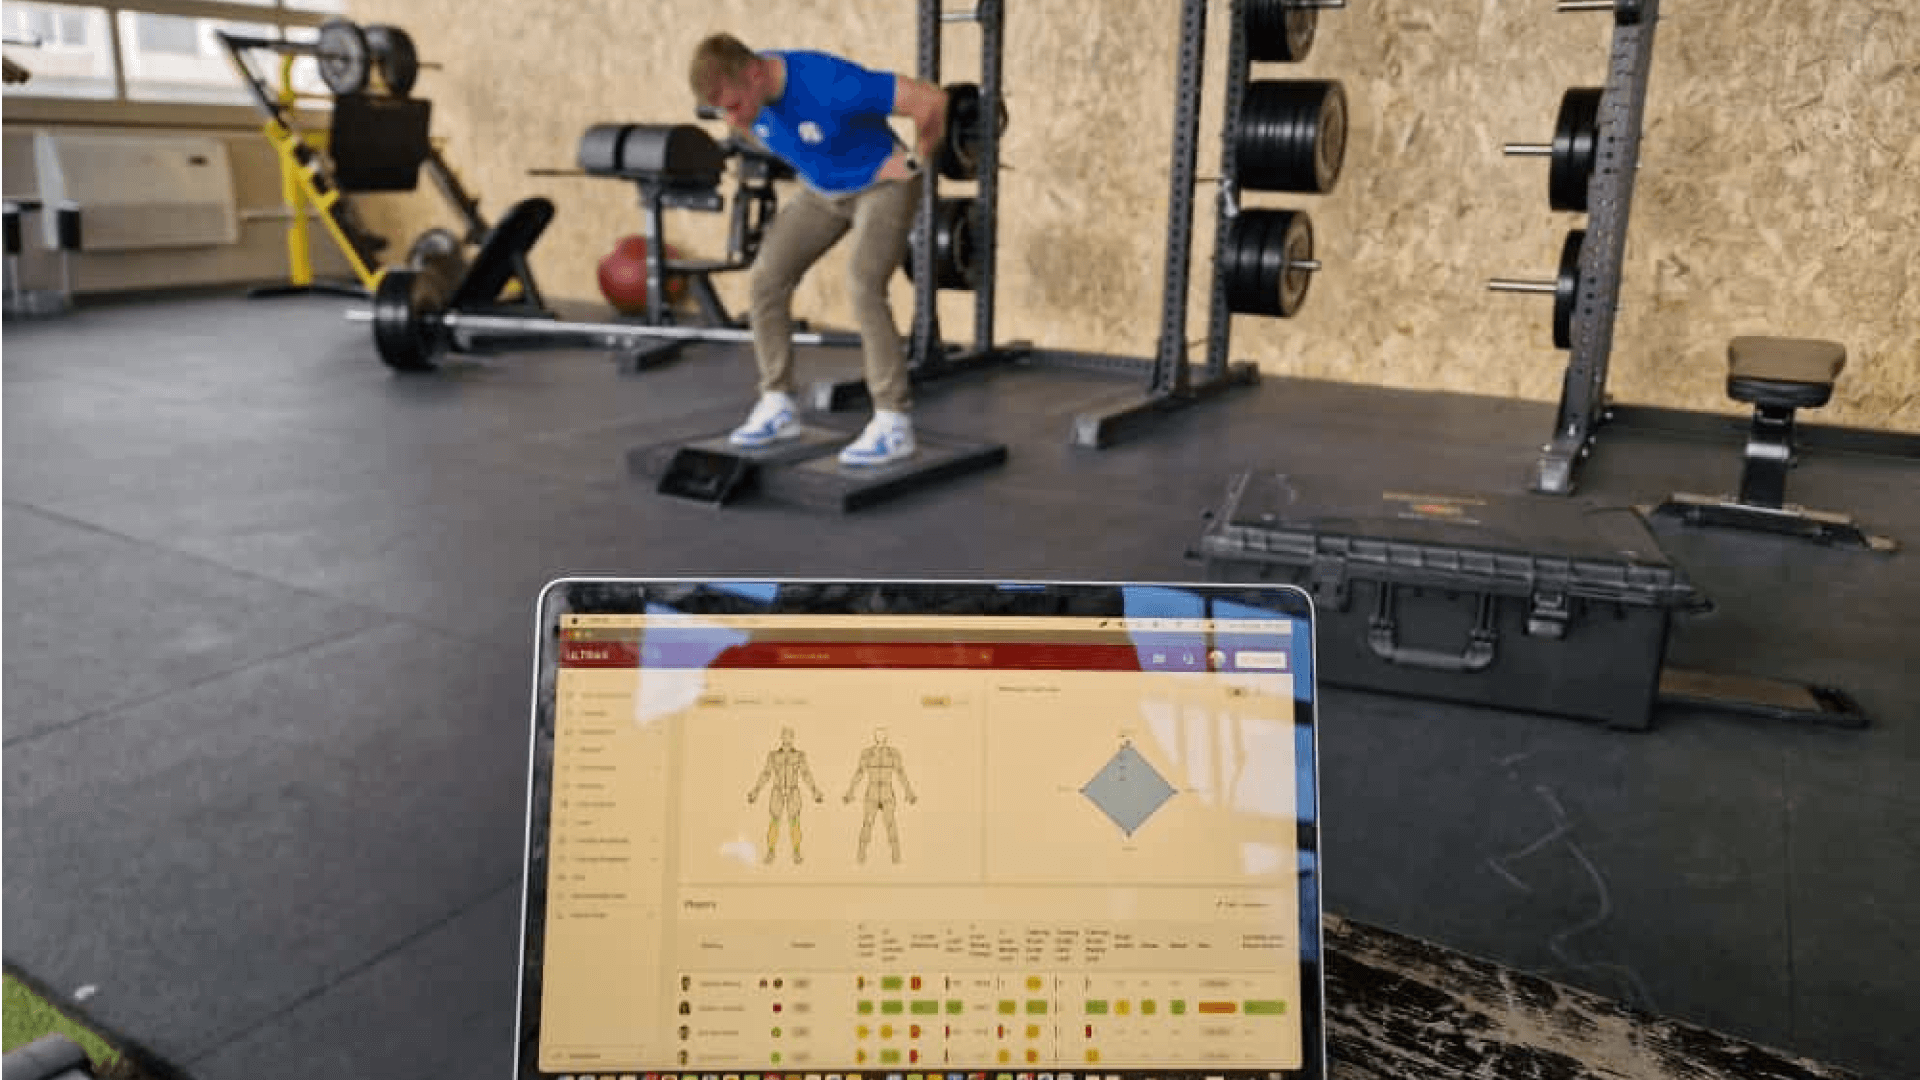
We tested 22 Croatian Second League players using VALD ForceDecks CMJ assessments, with three jump trials per athlete. Players underwent a standardized warm-up including foam rolling, dynamic mobility, and activation drills. Before drawing any comparisons with Premier League standards, let’s first take a look at what’s happening on home territory within the team itself.
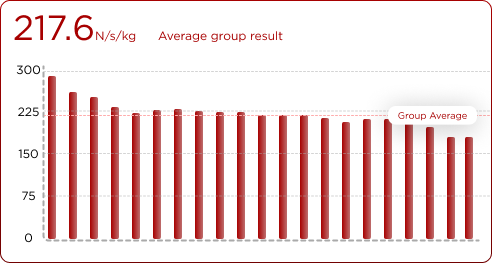
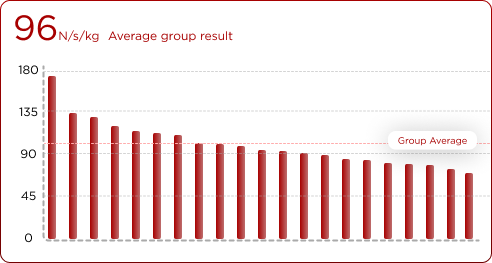
As we can see from the data, the group’s average Concentric Impulse (CI) sits at around 217.6 N/s, while the average Relative Eccentric Rate of Force Development (ERFD) is roughly 96 N/s/kg.
CI – Roughly half of the players are above the team average and half below. The spread is fairly tight, meaning propulsion ability is relatively consistent across the squad, with just a few players standing out at the top or bottom.
ERFD – The distribution is more uneven. Around 41% of the squad sits above the team average, while 59% are below. The spread is wider, with some players showing strong braking capabilities relative to body mass, and a larger group trailing behind.
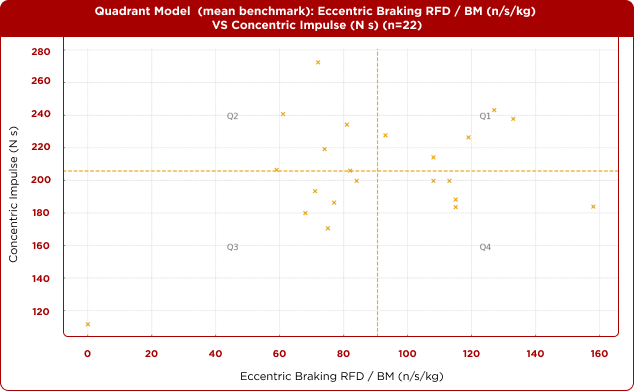
To see this more clearly, we plot the players on the Quadrant Model. Using the team averages CI ≈ 217.6 N/s and Relative ERFD ≈ 96 N/s/kg as the dividing lines, we can instantly see how the squad spreads out.
We divided the squad into four quadrants based on:
- X-axis: Eccentric Braking RFD / BM (deceleration ability)
- Y-axis: Concentric Impulse (propulsion ability)
Each player was placed into a quadrant depending on whether they were above or below the squad average in each metric.
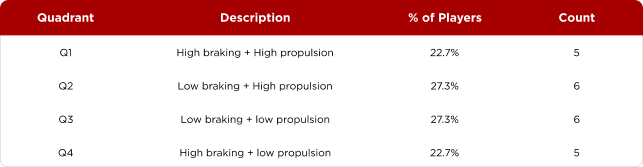
- Most players are in Q2 and Q3, each holds 27.3% of the squad.
- Q1 and Q4 are the smallest groups at 22.7% each.
- The squad is evenly spread, with no major imbalances across the quadrants.
- However, there is a slight lean toward weaker braking performance:
- 54.6% of players are below average in Eccentric Braking RFD (Q2 + Q3).
- In contrast, 50% of the players are above average in Concentric Impulse (Q1 + Q2).
- This tells us: More players are stronger in propulsion (push-off) than in braking (deceleration).
Comparing with the Premier League
Now that we’ve seen how our squad looks “internally”, it’s time to see how that picture changes when we hold it up against one of the toughest benchmarks in world football, the Premier League.
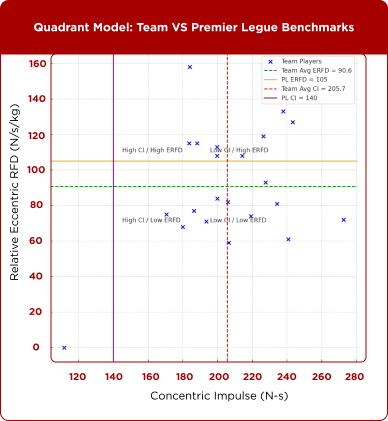
From VALD’s 2024/25 normative data, the Premier League median values for these two key variables are:
Concentric Impulse (100 ms) – around 140 N·s Eccentric RFD – around 105 N/s/kg
1. Propulsion (Concentric Impulse)
- Team Avg CI = 205.7 N·s vs PL Avg = 140 N·s
- Nearly every athlete on the squad exceeds the PL standard.
- This reflects: High concentric power output, force, well build momentum wich is underpinned by impuls.
2. Braking (Eccentric RFD)
- Team Avg Braking RFD = 90.6 N/s/kg vs PL Avg = 105 N/s/kg
- Over half the squad falls below the PL braking benchmark.
- A few players have very high braking, but most sit below average.
3. Quadrant Summary: How the Two Interact
Korištenje Premier League benchmarks as quadrant cut-offs:
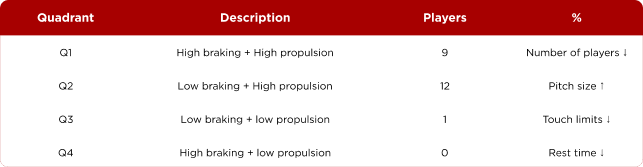
- Most players (95.4%) are above PL level in propulsion ( combining the data from two quadrants)
- However, 54.5% of the squad still lacks braking capacity by PL standards.
- Q2 dominates, these are players with great impuls but low eccentric braking RFD
When we look at the data as a whole, one thing is clear, our squad is built to go forward and go fast. Most of our players are producing force at levels that stack up well against Premier League standards. That’s a huge strength. What’s missing ,or at least not at the same level, is our ability to brake. The data shows that eccentric braking is a little behind where top-level players are. We all know football isn’t just about acceleration. It’s also about changing direction, defending, landing, wich comes down to absorbing all of the forces in a short period of time. When those are lacking, players are more exposed to injuries and less efficient in multidirectional movement. If we can bring the braking qualities up to match our propulsion, we’ll have a more complete and robust players.
Practical Coaching Applications
For sub-elite coaches, three takeaways stand out:
Prioritize Eccentric Strength
- Nordics, tempo squats, flywheel overload.
- Stronger brakes = better propulsion.
Use Quadrant Models
- Tailor interventions to quadrant placement instead of one-size-fits-all.
Make Testing Consistent
- Monthly testing builds profiles and tracks progress more reliably than occasional snapshots.
Why These Gaps Exist
The differences between Croatian Second League players and Premier League athletes aren’t just about raw talent or genetics. A significant part of the gap comes down to the systems, resources, and environments that players work in every day.
One of the biggest challenges at the sub-elite level is limited access to strength and conditioning support. In the Premier League, players benefit from large multidisciplinary teams with dedicated staff for strength and conditioning, recovery, nutrition, and performance analysis. Each athlete follows an individualized plan designed to optimize their physical development.
In the Second League, that level of support is much harder to come by. Fewer staff, less equipment, and infrastructural limitations often restrict what can be achieved on a daily basis.
Monitoring and feedback are another area where the difference is clear. At the highest level, CMJ testing is frequently performed, sometimes even daily. The resulting data allows coaches to adjust training loads, monitor fatigue, and make smarter, evidence-based decisions about their players. In the Second League, however, testing tends to be rare or inconsistent. Without that regular feedback, it becomes much harder for coaches to plan with confidence and precision.
Programming also highlights the divide. Force plate data consistently shows that athletes have very different performance profiles, some excel in the propulsion phase, while others are stronger in braking capabilities. Elite environments recognize these differences and tailor programs to each individual. In contrast, many sub-elite setups rely on a more generic, one-size-fits-all approach, which limits the potential for targeted development.
This analysis isn’t about pointing fingers at individual players; rather, it’s about identifying opportunities for growth. By building a clearer profile of where a team currently stands, we can target the right areas for improvement. But why stop at just one team? Expanding this approach across the entire Second League, testing each squad, mapping their CMJ and quadrant profiles, and comparing results, would provide a complete picture of where each club stands.
Closing the Neuromuscular Gap with Data-Driven Training
Diagnosing the Gap
To better understand the neuromuscular demands of the game, we began by testing a cohort of Croatian Second League players using VALD force plates. The data was then integrated into a diagnostic module, giving a clear and immediate view of athlete performance profiles. This step provided the foundation for identifying where individual strengths and weaknesses lie.
Diagnostic Video
Performance in Context: Decelerations Matter
Jump testing is valuable, but neuromuscular performance extends far beyond vertical output. How players decelerate under match and training conditions is just as important. By monitoring decelerations and categorizing them into different intensity goups moderate (≈2 m/s²), high (≈3 m/s²), and very high (≈4 m/s²), we can track total deceleration volume across sessions, weeks, and matches. From there, metrics such as the acute:chronic workload ratio (ACWR) can highlight sudden load spikes and flag potential risks before they translate into problems on the pitch.
Performance Analysis Video
From Data to Decisions
The real power lies not just in collecting numbers but in acting on them. If deceleration loads rise sharply or player wellness markers point to fatigue, early warnings can help coaches intervene proactively. Rather than waiting for performance drops or injuries to appear, the system encourages a more preventative, data-informed approach.
KPI Video
Smarter Interventions
Finally, diagnostics become most valuable when they shape training. By mapping athletes into performance quadrants, coaches can design more targeted and individualized protocols, whether that means focusing on propulsion, braking, or a balance of both. This way, interventions are no longer generic but built around the actual needs of each player.