

1. Why GPS thresholds matter in football
GPS monitoring has become a central part of load management in modern football. Among the commonly reported external-load metrics like high-speed running and sprint distance, both of which are often used to describe the most demanding passages of training and match play. These metrics help practitioners quantify exposure to intense running, compare positional demands, and guide decisions around training prescription, recovery, and return to play.
However, these measures are not as objective as they may first appear. Before any sprint distance is reported, a threshold must be chosen to define what counts as high-speed running or sprinting. That is importan because the threshold itself shapes the final output. In other words, practitioners are not only measuring load but also defining it.
This becomes especially important when players have different speed profiles. A fixed threshold may represent a very different physiological and mechanical demand for one player compared with another. As a result, two players can produce very different values in the same speed zone, not necessarily because their true high-intensity exposure was different, but because the threshold was not equally meaningful for both. This is where the distinction between absolute and relative speed zones becomes important, and why recent work, particularly Silva et al., has added important insight to the discussion.
2. The traditional model: absolute thresholds and standard speed zones
In many football settings, speed zones are still defined using absolute thresholds. This means that the same speed boundaries are applied to every player, regardless of their individual sprint capacity. it is simple, easy to communicate, and allows straightforward comparison across players, sessions, and teams.
A common version of this model divides movement into six speed zones, progressing from low-speed activity to sprinting. In the figure below, the zones are based on fixed kilometer-per-hour cut-offs, with the highest zones typically used to identify high-speed running and sprint exposure. In male soccer, these upper zones have commonly been operationalized with absolute cut-offs of >19.8 km/h for high-speed running and >25.2 km/h for sprinting, which remain widely used in both research and practice (Pimenta et al., 2025).
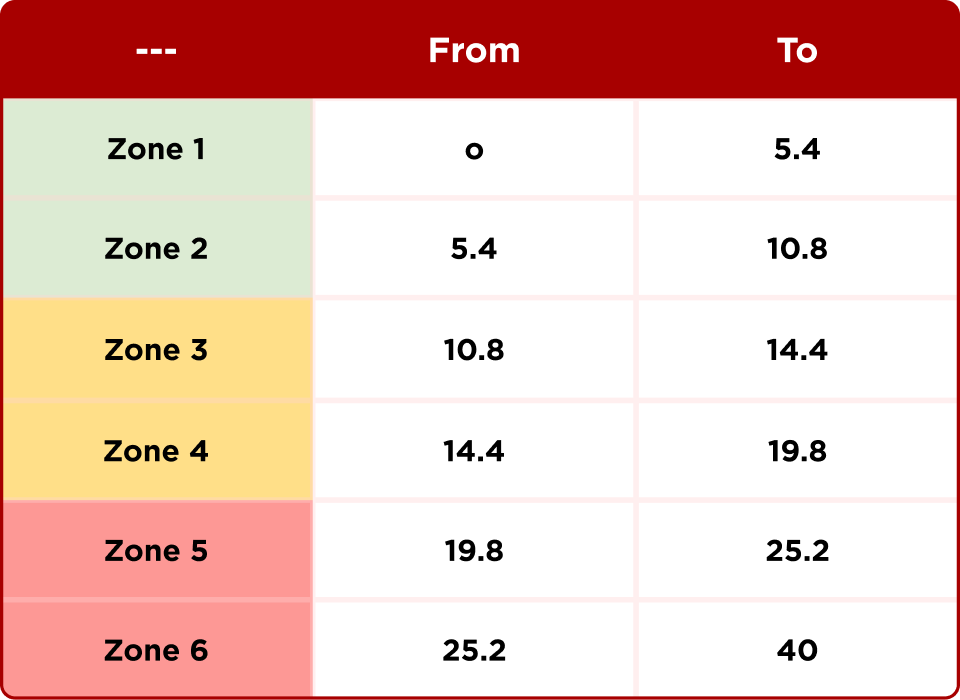
Example of absolute speed zones used in GPS monitoring.
In this structure, the upper zones are usually the most relevant for practitioners interested in external-load intensity. Zone 5 and Zone 6 are especially important because they capture the running actions most commonly associated with high-speed and sprint demands. The problem, however, is that these thresholds assume the same running speed represents the same level of effort for every player.
That assumption is difficult to defend in practice. A player with a high maximal sprint speed may spend less time above a fixed threshold than expected, even if the session was highly demanding for them. On the other hand, a player with lower top-end speed may enter these zones more often because the same threshold represents a greater proportion of their individual capacity. For that reason, absolute thresholds are useful for standardization, but they may not always reflect the true intensity of the work completed by each player.
3. Why fixed thresholds can misrepresent player load
A key study in this discussion is the work by Silva et al., because it moves the debate about speed thresholds away from theory and into a very practical question, does sprint distance change when the definition of sprinting changes? In many football environments, sprint exposure is still calculated using a fixed absolute threshold, commonly >25.2 km/h. Silva and colleagues challenged that logic by comparing this standard absolute threshold with several relative thresholds based on each player’s peak match speed, using bands such as 70%, 75%, 80%, 85%, and 90% of peak speed. The importance of this design is that it allows the same match actions to be interpreted through two different models, one standardized and one individualized.
What the paper showed is that the amount of distance recorded in the higher-speed zones changed depending on the thresholding approach used. That means sprint distance is not just a raw fact captured by GPS. It is partly a constructed outcome, shaped by the rule used to classify movement. In practical terms, the same player in the same match may appear to have completed a different amount of high-intensity work depending on whether the analysis uses absolute or relative speed boundaries.
This is where the issue becomes relevant for practitioners. Absolute thresholds are attractive because they are easy to apply and easy to compare across players. But that convenience comes with an assumption that the same speed corresponds to the same intensity for everyone. Football squads include players with very different profiles. One player may reach 25.2 km/h only when approaching maximal effort, while another may be able to exceed that speed much more, depending on their role and match context, may spend relatively little time above it despite performing repeated high-demand actions.
That creates a clear interpretive problem. A faster player may appear to accumulate less distance in the top speed zones, not necessarily because they were less exposed to intense work, but because the fixed threshold does not fully reflect their own capacity. At the same time, a slower player may appear to spend more distance in a high-intensity band because that band represents a larger proportion of their maximum speed. In other words, the threshold can distort the story of load exposure at the individual level. Pimenta et al. make this especially clear by showing that, for a player with a maximal speed of 35 km/h, the traditional sprint threshold of 25.2 km/h corresponds to only about 72% of maximal speed, which is below what many would consider true sprint intensity (Pimenta et al., 2025).
This matters because GPS data are often used to support decisions that are individual by nature. Sport scientists and coaches do not monitor HSR and sprint distance only for descriptive purposes, they use them to guide training prescription, evaluate match demands, assess readiness, monitor fatigue, and inform return-to-play progression. If the threshold used to define high-intensity work does not reflect the individual athlete, then the metric may be less useful for those decisions. A value that looks low on paper may still represent a meaningful high-speed stimulus for one player, while a higher value in another player may not represent the same relative demand.
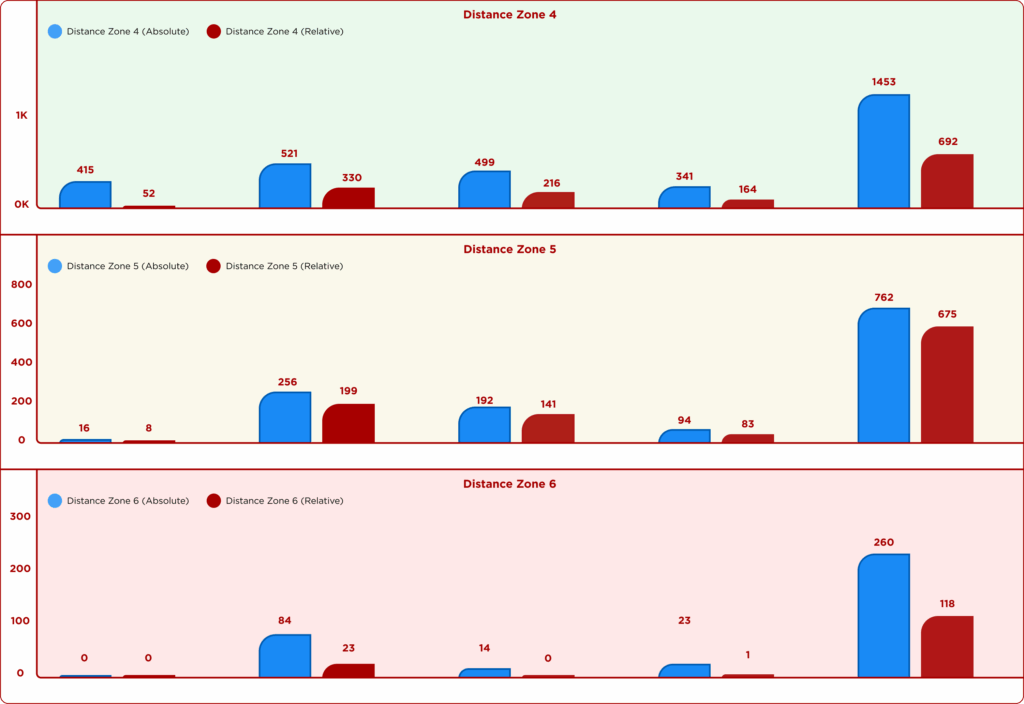
The figure below helps make this point more concrete. When absolute and relative zones are compared side by side, the distances recorded in the upper zones do not align perfectly. The discrepancy is not trivial. It shows that threshold choice changes the amount of work assigned to each intensity band, especially in the higher-speed categories where practitioners often focus most of their attention.
The positional perspective makes this issue even more important. Pimenta et al. reported that the comparison between absolute and normalized thresholds was not uniform across roles. Midfielders were the only position to cover greater distance in the 55–70% maximal-speed band than in absolute HSR, fullbacks and wingers showed similar HSR patterns, and strikers did not cover any distance above 95% maximal speed. More broadly, the study showed significant between and within-position differences, suggesting that fixed thresholds may lack the sensitivity required to fully capture the different load intensities associated with tactical roles (Pimenta et al., 2025).
4. How relative thresholds individualize load monitoring
Relative speed zones were introduced to make GPS-derived running metrics more sensitive to the individual athlete. Instead of assigning the same speed thresholds to every player, the relative approach defines intensity in relation to a player’s own speed profile.
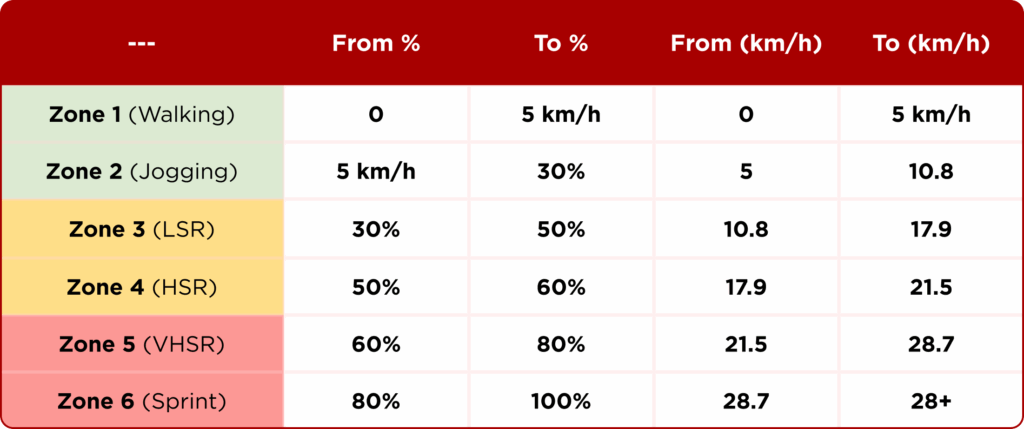
Example of relative GPS speed zones based on percentages of an individual player’s speed capacity.
The scientific logic behind this approach is straightforward. Running at a given speed does not represent the same mechanical or neuromuscular demand for every player. A movement speed that is moderate for one athlete may be highly demanding for another, depending on sprint capacity, aerobic qualities, training background, and playing profile.
Different methods have been used to establish these relative zones. In some cases, thresholds are based on a percentage of maximal sprint speed, in others they are linked to markers such as maximal aerobic speed or anaerobic speed reserve. Although these methods are not identical, they share the same principle.
One of the key ideas when working with relative speed zones is the use of 80% of a player’s maximal speed as a reference point. Above this level, movements are closer to maximal effort, placing greater demands on the players’ locomotor and energy systems.
Sprinting doesn’t start at the same fixed speed for everyone, it starts when a player reaches a high enough percentage of their own top speed. That’s the difference. For a faster player, the sprint threshold will be higher. For a slower player, it will be lower. But in both cases, it represents a similar level of effort.
This is where relative thresholds start to make more sense in practice. If you use a fixed number like 25.2 km/h, it might be very demanding for one player but not for another. Using something like 80% helps level that out.
Zaključak
GPS speed thresholds do more than organize running data, they shape how high-intensity load is understood in football. Absolute thresholds remain useful because they are simple and easy to standardize, but they may not reflect the same demand for every player or position. Recent research suggests that when sprinting and high-speed running are defined relative to individual capacity, the load profile can look very different.
Reference
Clemente, F. M., Ramirez-Campillo, R., Beato, M., et al. (2023). Arbitrary absolute vs. individualized running speed thresholds in team sports: A scoping review with evidence gap map. Biology of Sport, 40(3), 919–943.
Freeman, B. W., Talpey, S. W., James, L. P., Opar, D. A., & Young, W. B. (2023). Common high-speed running thresholds likely do not correspond to high-speed running in field sports. Journal of Strength and Conditioning Research, 37(7), 1411–1418
Silva, H., Nakamura, F. Y., Loturco, I., Ribeiro, J., & Marcelino, R. (2024). Analyzing soccer match sprint distances: A comparison of GPS-based absolute and relative thresholds. Biology of Sport, 41(3), 223–230.
Gualtieri, A., Rampinini, E., Sassi, R., et al. (2023). High-speed running and sprinting in professional adult soccer: A systematic review. Frontiers in Sports and Active Living, 5, 1116293.
Pimenta, R., Antunes, H., Maia, F., Ribeiro, J., & Nakamura, F. Y. (2025). Sprint and high-speed running in soccer: Should we use absolute or normalized thresholds? Journal of Human Kinetics. Advance online publication
Bošković, A. (2023, June 4). Using the GPS system in soccer: Planning, periodization, load distribution. Complementary Training.