
Introduction
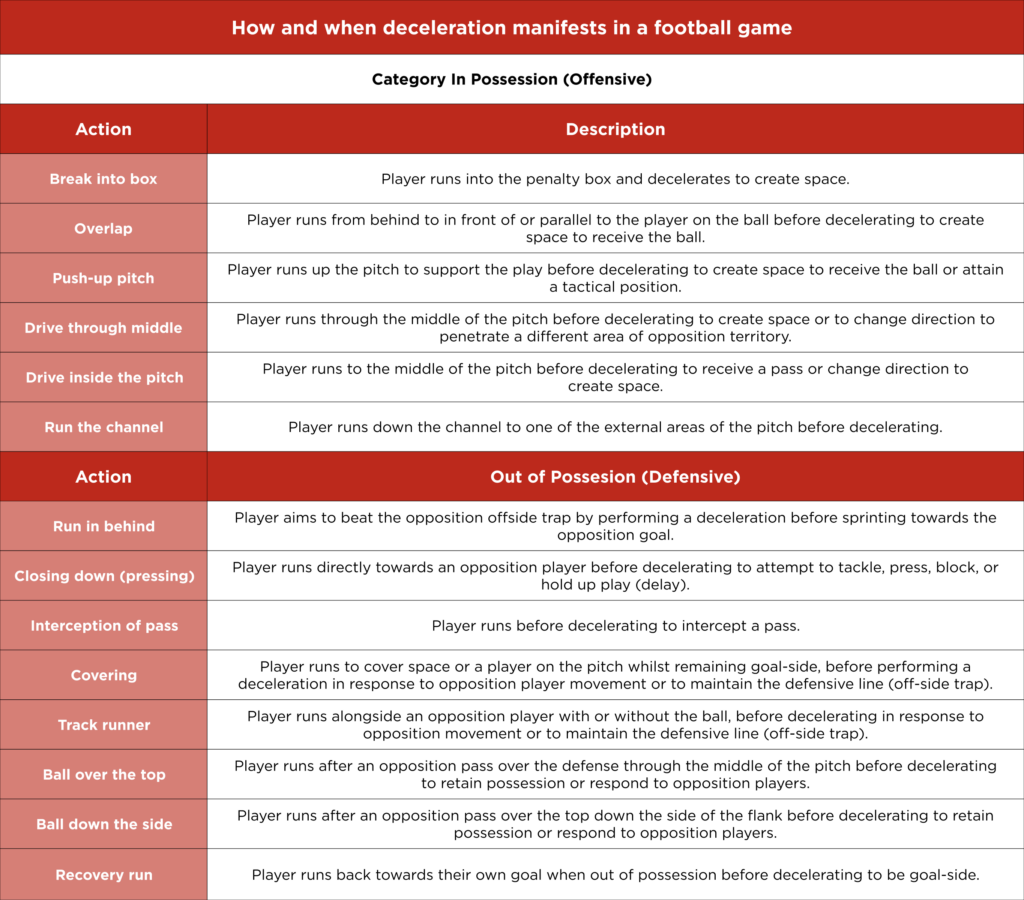
We all know how important acceleration, speed, and change of direction are for achieving top performance on the football field. Football is a multidirectional speed sport, and one aspect that has only been extensively researched in recent years is deceleration. Let’s go through what deceleration is, how and when it manifests in a football game (Table 1), and how we can diagnose it to understand the values our players have in this ability.
Deceleration in football is a crucial skill, especially when players need to quickly reduce their speed to change direction, react to the ball, or get into defensive positions. It typically occurs when a player is sprinting and needs to slow down to either stop or change their direction, which is vital in many game situations like tracking back after an attack or making sharp turns (Figure 1).

To diagnose deceleration, we can use various tools such as speed measurement devices, motion sensors, and video analysis. This helps us monitor the moment a player reaches their maximum speed and identify the point when they start to slow down. Tests such as the ADA test (Acceleration-Deceleration Ability) or change of direction tests (COD) are effective for measuring deceleration skills. By using these tests, we can assess how quickly players reduce their speed and adjust their body mechanics accordingly.
Understanding a player’s deceleration ability is crucial for improving their performance and reducing the risk of injury, as proper deceleration techniques help avoid unnecessary strain on muscles and joints. Through careful testing and analysis, coaches can design training programs that target and improve these specific abilities, helping players perform at their best in high-intensity game situations.
The Key to Effective Training: Horizontal Deceleration Assessment
To create impactful training sessions, the first step is understanding the specific abilities you want to develop. Recently, researchers have turned their focus toward practical protocols that reliably assess athletes’ horizontal deceleration skills. These protocols fall into two main categories:
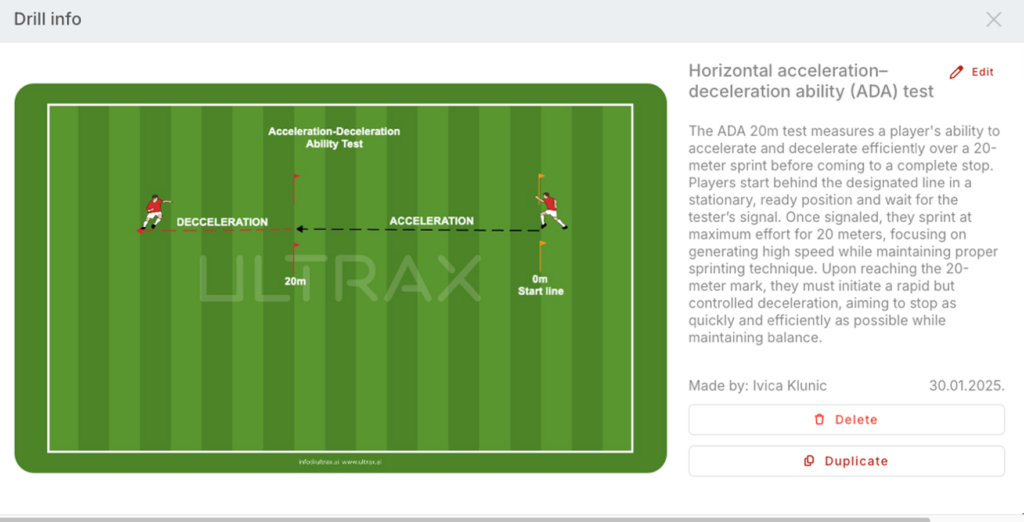
- Acceleration and Deceleration Ability (ADA) Tests (Figure 2)
What Do These Tests Involve?
ADA Tests evaluate deceleration in two scenarios:
- Decelerating before change of direction.
- Decelerating and stopping at a predetermined distance.
2. Change of Direction (COD) Tests (Figure 3)
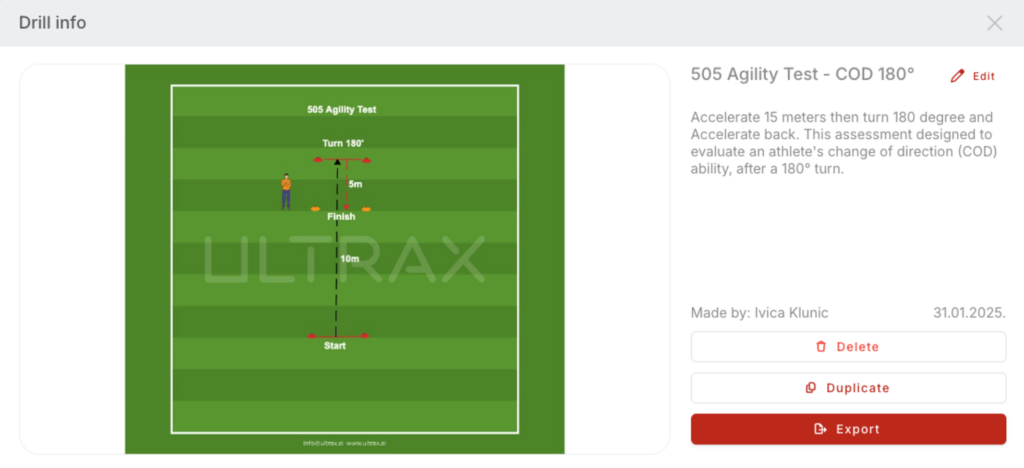
COD Tests assess the athlete’s ability to decelerate sharply before making a turn (typically greater than 90°) and re-accelerating afterward. For instance, the widely-used 505 Test (Figure 3) involves a sprint followed by a 180° turn, isolating the ability to change direction in the horizontal plane. The test is both physically demanding and a reliable measure of COD s
Why the Pre-Deceleration Distance Matters
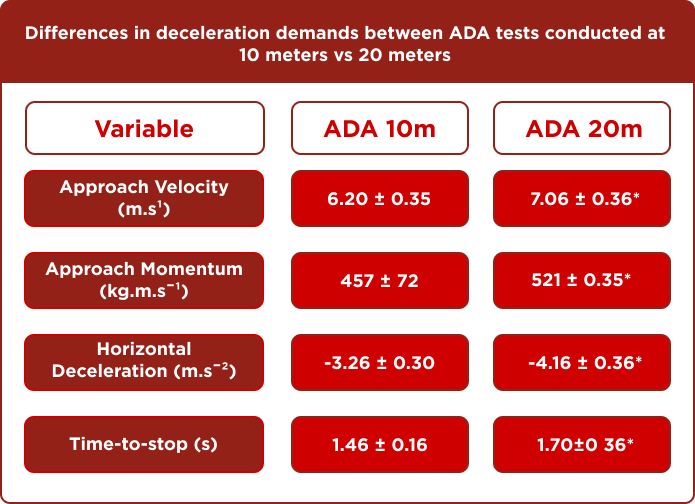
The sprint distance before deceleration plays a critical role. Studies show significant differences in deceleration demands between ADA tests conducted at 10 meters versus 20 meters. Table 2 highlights differences in approach velocity, momentum, deceleration, and time-to-stop. In the ADA 10m test, players reached an average approach velocity of 6.20 ± 0.35 m·s⁻¹, whereas in the ADA 20m test, they achieved a higher velocity of 7.06 ± 0.36 m·s⁻¹, indicating greater speed buildup over the longer distance. This increase in velocity resulted in higher approach momentum, with values of 457 ± 72 kg·m·s⁻¹ for ADA 10m and 521 ± 0.35 kg·m·s⁻¹ for ADA 20m, demonstrating the greater force generated before deceleration. Consequently, horizontal deceleration was more intense in the ADA 20m test, recorded at -4.16 ± 0.36 m·s⁻² compared to -3.26 ± 0.30 m·s⁻² in the ADA 10m test, as players had to dissipate more speed over a short distance. This greater deceleration demand also resulted in a longer time-to-stop, with players requiring 1.70 ± 0.36 seconds to come to a halt in the ADA 20m test, compared to 1.46 ± 0.16 seconds in the ADA 10m test. These findings illustrate how increased sprint distance influences approach speed, momentum, and deceleration demands.Athletes often perform well in one test but not the other, highlighting how varying sprint distances affect results (Philipp et al., 2023). Similarly, in COD tests, braking strategies change based on the distance and the number of steps required before the turn. A comprehensive profile should account for deceleration from both lower and higher speeds, as these involve distinct physical demands, postures, and step mechanics.
Measuring Deceleration
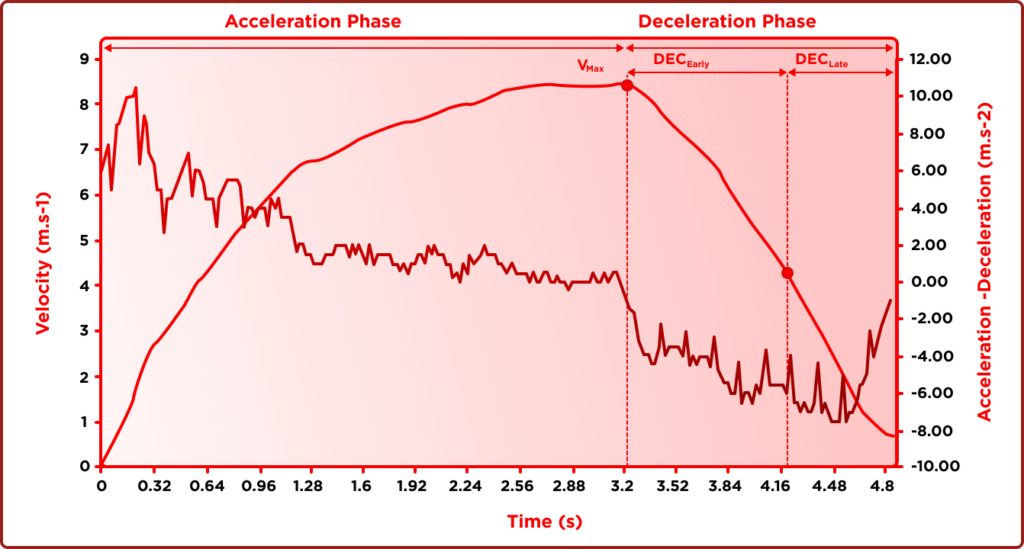
Accurately assessing deceleration hinges on selecting the right measurement device. Whether using radar, LiDAR, GPS, high-speed cameras, or motorized resistance systems, it’s essential to identify when an athlete hits their maximum speed (Vmax). This marks the transition to the deceleration phase, which ends at the lowest speed (VLow). For a granular analysis, deceleration can be divided into:
- Early Phase (DEC Early): Initial braking period.
- Late Phase (DEC Late): Final slowdown, typically identified at 50% of Vmax.
Insights from Speed-Time Profiles
Speed versus time profiles offer invaluable insights. For example, during an ADA test with a 20-meter sprint, deceleration begins immediately after reaching Vmax (Figure 4). Instantaneous acceleration and deceleration data derived from these profiles provide a deeper understanding of an athlete’s braking capabilities.
The Math of Deceleration
Deceleration is calculated using the formula:
Deceleration (m/s²) = (vf – vi) / (tf – ti)
Where:
- v is speed.
- t is time.
- f denotes final values.
- i denotes initial values.
The Modified 505 Test
A notable advancement in deceleration testing is the modified 505 test. Using motorized resistance devices like the 1080 Sprint, which record at high frequencies (e.g., 333Hz), researchers have validated this test as a reliable alternative to traditional methods. The deceleration phase is clearly observable before the athlete turns (Figure 5, Figure 6), making it ideal for detailed assessments.
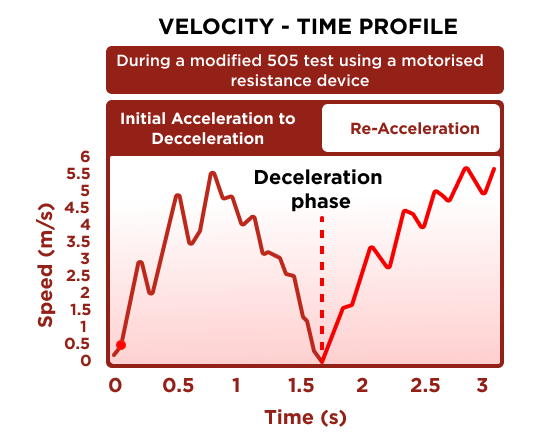
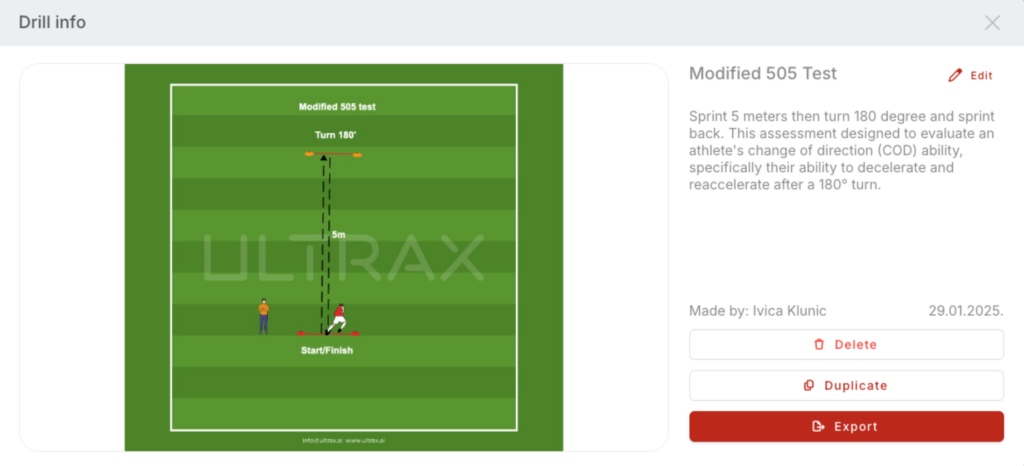
To perform a modified 505 COD test the athlete must accelerate 5 meters then decelerate, turn 180 degree and reaccelerate. Figure 6 illustrate the modified 505 test created in Ultrax Drill Builder.
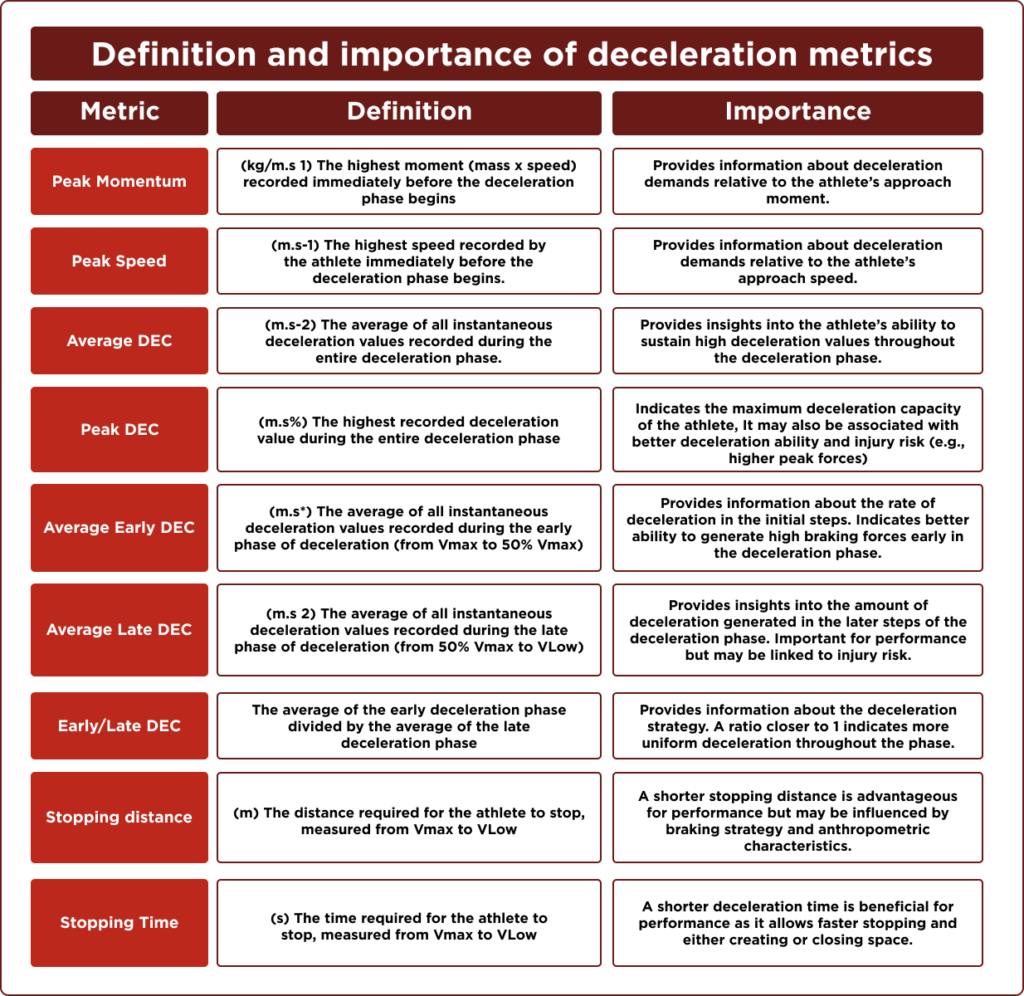
Deceleration metrics
The metric values measured and calculated during deceleration provide crucial insights into an athlete’s braking abilities and overall performance (Table 3). Each metric has a specific definition that helps assess different aspects of the deceleration phase, such as peak braking force, stopping distance, and braking strategy. Understanding these values allows coaches and sports scientists to tailor training programs that enhance an athlete’s ability to decelerate efficiently while reducing the risk of injury.
Athlete Braking Performance Profile Using a Customized Athletic Scoring System
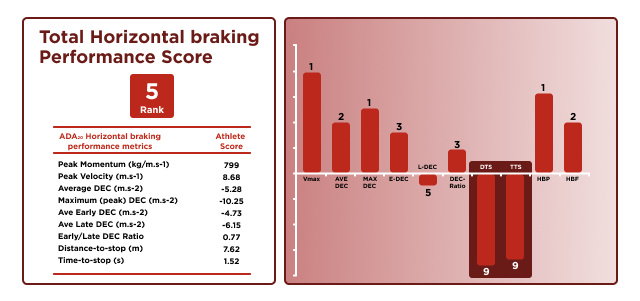
A performance profile of athlete braking can be developed using an adapted version of the Total Athleticism Score proposed by Turner (2019) (Figure 7). This approach provides a more comprehensive view of the athlete’s overall braking ability. Beyond evaluating horizontal braking performance using the 20m ADA test, the countermovement jump (CMJ) is incorporated to reveal specific neuromuscular qualities that may support horizontal deceleration capabilities (Harper, Cohen et al., 2020).
In the example illustrated in Figure 7, the athlete recorded the highest peak speed and inertia prior to the deceleration phase, securing the top rank within the group. However, despite their strong performance in horizontal braking metrics, their stopping distance and stopping time were among the lowest in the group. This underscores the significant impact of peak approach speed, inertia, braking strategies, and anthropometric characteristics on these outcomes.
Insights from Vertical Metrics
Vertical metrics, such as those derived from the countermovement jump (CMJ), offer valuable observations. Although this athlete demonstrated strong horizontal braking performance, their performance in the eccentric (downward) phase of the CMJ indicates room for improvement. Enhancing performance during these eccentric phases could further boost horizontal braking capabilities, potentially reducing both deceleration distance and stopping time.
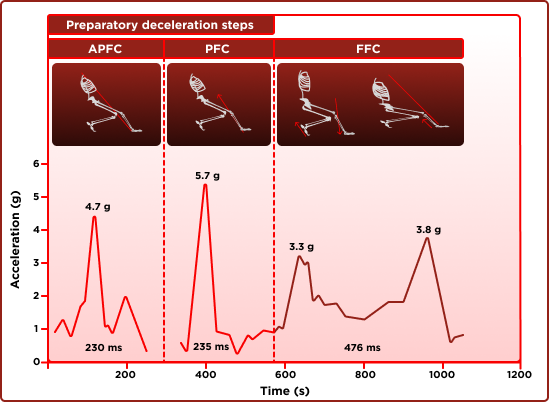
For example, exercises targeting rapid eccentric braking abilities may decrease the duration of the eccentric phase, improve peak eccentric force, and enhance eccentric deceleration force rate of development (RFD) (Harper et al., 2022). In Figure 8, we can see the forces generated during ground contact in the initial steps of braking. Trunk acceleration forces during the ante-penultimate (APFC), penultimate (PFC), and final foot contact (FFC) of a sharp 135° change of direction. Data taken from Nedergaard et al. Additionally, vertical braking profiles could be supplemented with neuromuscular performance data from drop jumps (DJ), as some metrics from these tests are also correlated with horizontal deceleration ability (Harper, Cohen et al., 2022). Additional research is required to assess the effectiveness of interventions designed to enhance both horizontal and vertical braking capabilities and their influence on horizontal deceleration performance.
Advanced Kinematic Insights
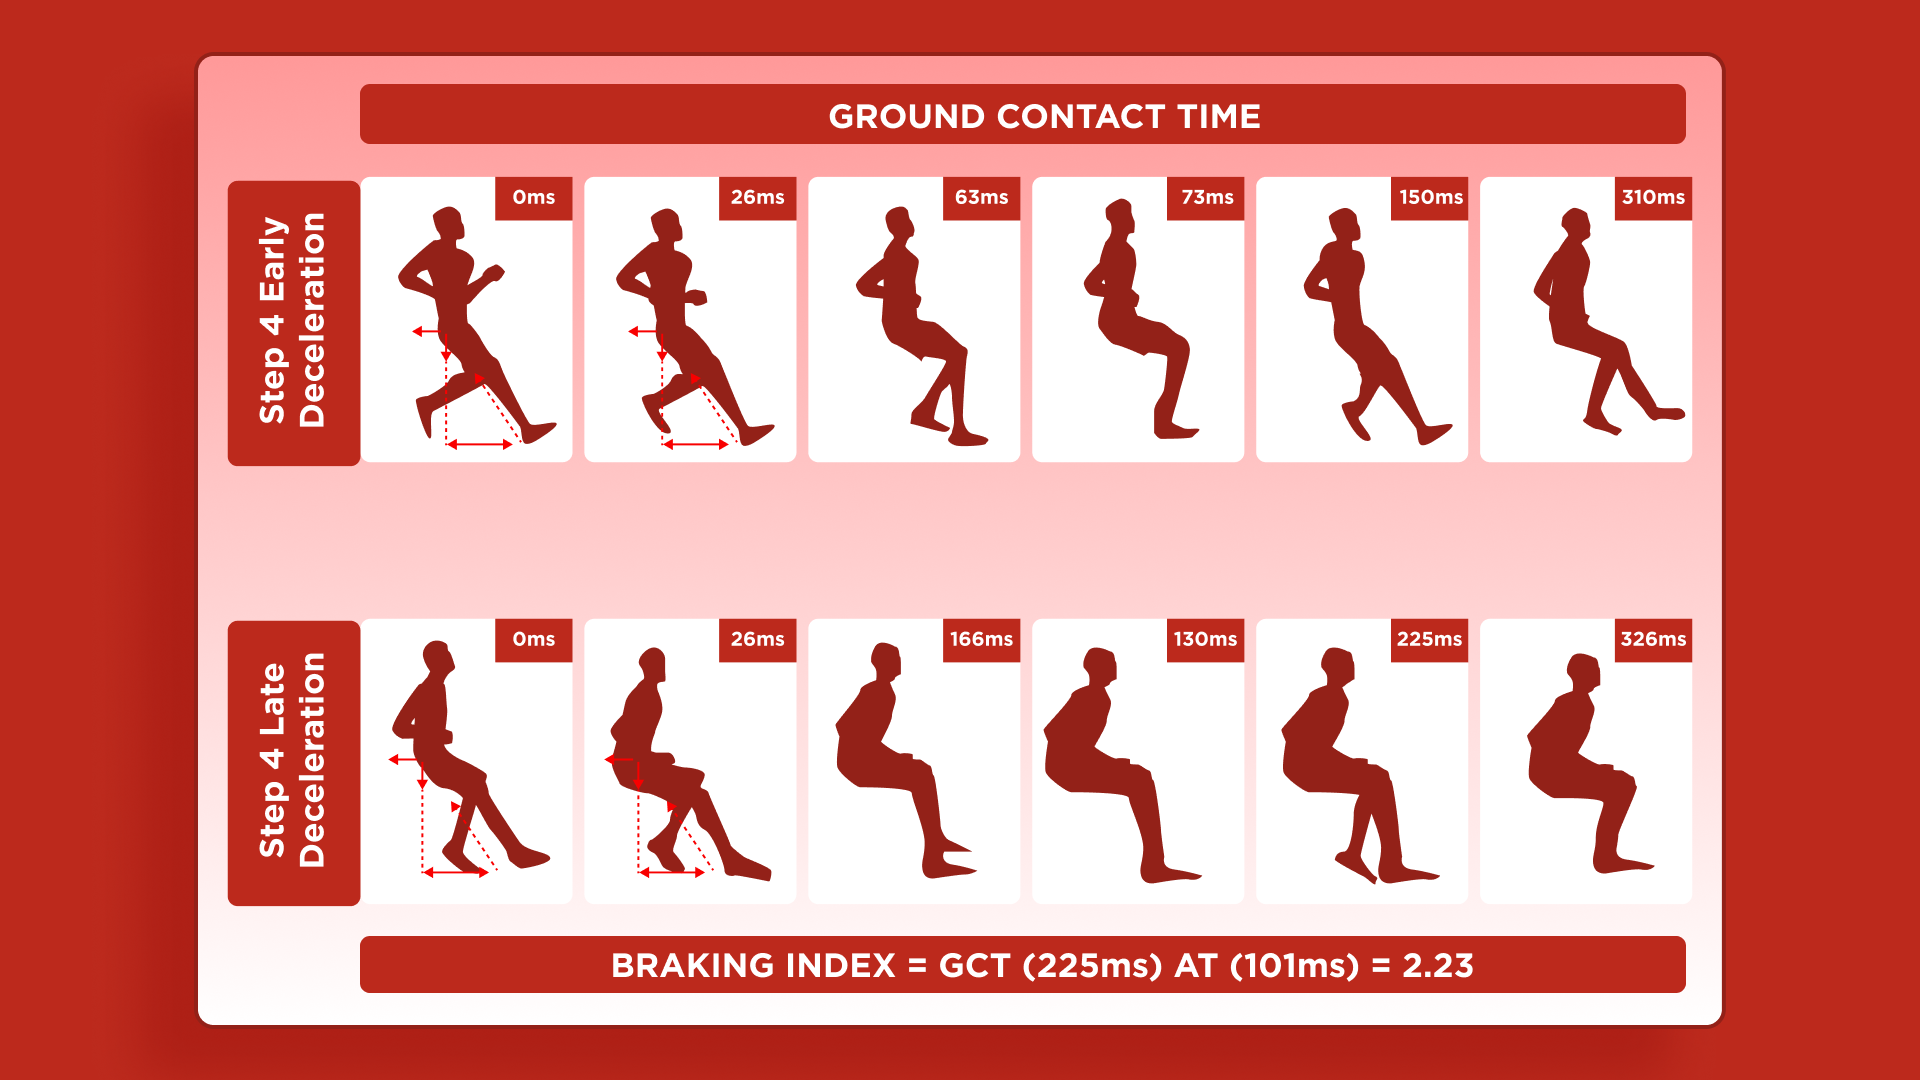
Alongside body speed data over time, practitioners can analyze additional kinematic variables using high-speed video footage. This allows for a deeper assessment of joint kinematics and spatial-temporal step characteristics, such as:
- Ground contact time (GCT)
- Air time (AT)
- Step length
- Step frequency
- Ground contact distance
- Deceleration per step
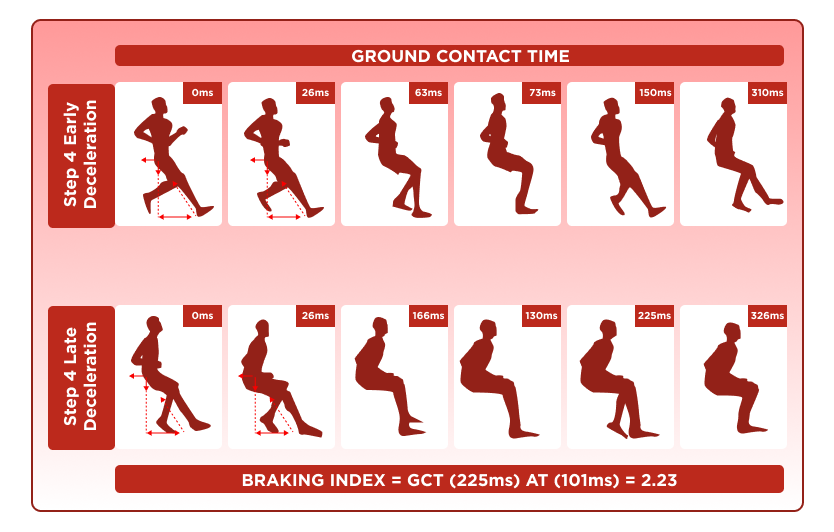
Early vs. Late Deceleration Phases
Key metrics such as GCT and AT can be used to calculate the braking index (GCT/AT)(Figure 9), providing insights into the unique demands and performance of individual braking steps during the early and late deceleration phases.
- Early Deceleration Phase: Braking steps in this phase have significantly shorter GCT compared to the late phase, requiring athletes to generate braking forces in much shorter time intervals (i.e., rapid braking force generation). This is reflected in a much lower braking index (e.g., 0.94).
- Late Deceleration Phase: Steps in this phase exhibit longer GCT, resulting in a higher braking index (e.g., 2.23).
The unique braking characteristics linked to different deceleration phases probably necessitate the development of specialized physical abilities tailored to each phase.
By utilizing detailed insights into braking mechanics and neuromuscular performance, coaches and practitioners can design customized training programs that meet the specific demands of horizontal and vertical braking, ultimately improving athletic performance while reducing injury risk.
Conclusion
In conclusion, conducting diagnostic assessments of an athlete’s abilities, particularly in horizontal deceleration, is essential for effective training. Research focuses on acceleration and deceleration ability (ADA) tests, as well as change of direction (COD) tests, where sprint distance significantly impacts performance. The modified 505 test, which measures a 180° change of direction, is considered a reliable assessment. Identifying the exact moment an athlete reaches maximum speed is crucial for accurately tracking the deceleration phase. Various devices, including GPS and high-speed cameras, are used to measure speed throughout testing. Speed-time analysis provides key metrics such as average and peak deceleration. Deceleration performance reflects an athlete’s ability to reduce speed rapidly, while the ratio of early to late deceleration can reveal braking strategies. Additionally, vertical performance, including data from vertical jumps, should be considered to further enhance braking capabilities. Advances in technology allow for a detailed analysis of mechanical demands, which is essential for developing effective training and rehabilitation programs.
Literature
- Harper, D.J., McBurnie, A.J., Santos, T.D. et al. Biomechanical and Neuromuscular Performance Requirements of Horizontal Deceleration: A Review with Implications for Random Intermittent Multi-Directional Sports. Sports Med 52, 2321–2354 (2022). https://doi.org/10.1007/s40279-022-01693-0
- Harper, D., Cervantes, C., Van Dyke, M., Evans, M., McBurnie, A., Dos’ Santos, T., Eriksrud, O., Cohen, D., Rhodes, D., Carling, C., & Kiely, J. (2024). The Braking Performance Framework: Practical Recommendations and Guidelines to Enhance Horizontal Deceleration Ability in Multi-Directional Sports: The Braking Performance Framework. International Journal of Strength and Conditioning, 4(1). https://doi.org/10.47206/ijsc.v4i1.351
- Turner, Anthony & Jones, Ben & Stewart, Perry & Bishop, Chris & Parmar, Nimai & Chavda, Shyam & Read, Paul. (2019). Total Score of Athleticism: Holistic Athlete Profiling to Enhance Decision- Making. STRENGTH AND CONDITIONING JOURNAL. 10.1519/SSC.0000000000000506.
- Harper, D. J., Cohen, D. D., Carling, C., & Kiely, J. (2020). Can Countermovement Jump Neuromuscular Performance Qualities Differentiate Maximal Horizontal Deceleration Ability in Team Sport Athletes?. Sports (Basel, Switzerland), 8(6), 76. https://doi.org/10.3390/sports8060076