Introduction
Soccer is a physically demanding sport that requires a combination of aerobic and anaerobic fitness. Soccer players need to sprint, accelerate quickly, and change direction to beat their opponents (Taylor et al., 2004, 2017). High-speed running (HSR) (> 19.8 km/h -1) and sprinting (> 25.1 km/h -1) distance is positively associated with the number of matches won by a team (Chmura et al., 2018). Furthermore, the ability to sustain HSR and sprinting during entirety of a soccer match is a key characteristic of professional soccer players (Chmura et al., 2017). Specifically, in professional male soccer, the distance covered with the velocity
pertaining to HSR and sprinting was around 760 m and 200 m respectively (Gualtieri et al., 2023). Furthermore, linear sprinting has been identified as the single most frequent locomotive action preceding goal situations, performed by either the scoring player or the assisting one (Martínez- Hernández et al., 2023).
Speed testing has become an integral component of performance assessment in soccer due to the significant role speed plays in the sport (Gualtieri et. al., 2023). Measuring an individual’s sprint performance is a fundamental component of athletic performance assessment (Altmann et al., 2019; Keir et. al., 2013, Buchheit et al., 2012). This can be assessed by testing linear sprinting speed over various distances including acceleration and maximum sprinting speed (Altman et. al. 2019). Sprint performance is influenced by several key factors: maximal power output, the force-velocity characteristics of the lower limbs (Haugen et. al., 2019) and sprint technique (Willer et. al., 2024).
Therefore, relying exclusively on sprint times to evaluate sprint performance might not fully encompass all the factors that contribute to it (Samozino et. al., 2022). To get a more in-depth understanding of the athletes biomechanical and neuromuscular capabilities that determine performance a promising method was proposed by Samozino et al. (2014). This method provides a deeper understanding of sprinting mechanics by analyzing underlying metrics such as maximal theoretical horizontal force and velocity (Fh0 and Vh0). Additionally, it enables the calculation of maximal horizontal power (Phmax) and maximal velocity reached at the end of the acceleration (Vmax) (Samozino et. al., 2022).
Utilizing the force-velocity-power (FVP) profile offers valuable insights into individualized training prescription. For instance, individuals identified as force deficient would prioritize enhancing Fh0 to reduce force velocity imbalance (FVimb), whereas those with velocity deficiencies would focus on the opposite strategy (Morin and Samozino, 2016; Jiménez-Reyes et al., 2017, 2019).
The results of such training led to an increase in jump height and a decrease in FVimb, however, there was no change in maximal power (Pmax). Muscular power is a strong predictor of explosive-type athletic performance (Sleivert & Taingahue, 2004; Harris et al., 2008; Morris et al., 2022). The orientation of the force vector in jumping is primarily vertical, meaning that biomechanical and physiological demands of these activities are distinct, necessitating task-specific
assessments to accurately capture an athlete’s performance capabilities (Randell et. al., 2010; Marcote-Pequeño et. al., 2019). Therefore, it is questionable if individualized FVimb training, based on jump FVP profile, is relevant for improvement in other athletic tasks (e.g., sprinting).
In recent years, the sprint-derived FVP profile has gained popularity for its use in personalizing resistance training and assessing its effectiveness. A recent study showed that changes in FVimb were unrelated to changes in 10 and 30 m sprint split time (Lindberg et al., 2021). Maximal strength training increases the ability of muscles to produce force (and thus increases Fh0), while training at high- velocity conditions (i.e., ballistic training) increases the Vh0 (Jiménez-Reyes et al., 2019).
There is strong evidence that a short-term intervention involving strength or ballistic training in young males significantly improves athletic performance (e.g., sprinting) (Cormie et al., 2007; Wilson et al., 1993; Häkkinen et al., 1985), which in turn has a significant and specific impact on the FVP profile. Norgeot & Fouré (2024) implemented an 8-week plyometric training program with youth soccer players.
The participants in the study were divided in two training groups performing either vertical (n = 14; age: 14.5 ± 0.5 years) or horizontal (n = 14; age: 14.5 ± 0.5 years) plyometric training. The results demonstrated significant improvements in both groups for sprint times (from −5.5% to −8.7%) and FVP parameters. Higher relative improvements were observed in the horizontal group compared to the vertical group for 5m and 15m sprint times and FVP parameters, particularly in Pmax (vertical: +16.4% vs. horizontal: +28.1%) and decrease in ratio of force (+22.9%) during the 30m sprint.
Furthermore, Bettariga et al. (2023) conducted a study in which twenty-four amateur male adult soccer players (age: 25.4 ± 4.9) were randomly assigned to either a 6-week unilateral strength and ballistic jump training group (n = 12) or a control group (n = 12).
After 6 weeks of training, the experimental group, showed small to moderate significant improvements in sprint split time from 10 to 30 meter (g = 0.64–0.81), as well as in the following mechanical parameters: Vh0 (g = 50.81), Pmax (g = 50.49), the maximal ratio of horizontal-to-resultant force (g = 50.55), Vopt (g = 5 0.83), and Max speed (g = 520.84). It seems that to improve performance, the main goal should be to shift the entire FVP curve of an athlete’s FVP profile to the right, and with that improve power across the entire FVP continuum. Consequently, this raises the question of the necessity for individualized training programs tailored specifically to an athlete’s sprinting FVP characteristics.
Little is known about whether ballistic or strength training enhances the FVP profiles of young soccer players. Furthermore, it remains unclear whether the mechanisms underlying adaptations of the FVP profile significantly impact athletic performance.
Thus, the aim of the current study was to explore whether strength or ballistic training interventions would lead to adaptations in the FVP profile of soccer players, resulting in improved athletic performance. We hypothesized that the group focusing on speed training) would experience a notable enhancement in Vh0, while the group concentrating on strength training would exhibit a notable improvement in Fh0. Our second hypothesis was that the speed group would improve their sprint time to a greater extent compared to the strength group. This information will help practitioners develop effective training programs, which will aid in athlete development.
Methods
Study Design
We used a parallel-group, randomized-controlled trial study design. Participants were randomly allocated to either the intervention or the control group (i.e. mixed modality group) by drawing cards from opaque sealed envelopes. After the randomization to allocate participants into the intervention and mixed-modality group, participants in the intervention group were allocated into two groups. Specifically, in our study the athletes didn’t train away or toward their optimal FVP profile, as previous studies showed no difference between these two training modalities (Lindberg et. al., 2021). A 1:1:1 ratio was employed between the experimental and mixed-modality groups to ensure a sufficient number of participants in the intervention group.
We randomly assigned athletes to the strength group (n = 8), where the program consisted of exercises with high loads and to the speed group (n = 8), where the program consisted of exercises with low loads and high velocity. The mixed-modality group (n = 8) participated in a basic preventive training regimen, based on the FIFA 11+ program (Barengo et. al., 2014), without running exercises and was designed and supervised by their strength coach. This regimen included a combination of various exercises targeting injury prevention and overall athletic conditioning.
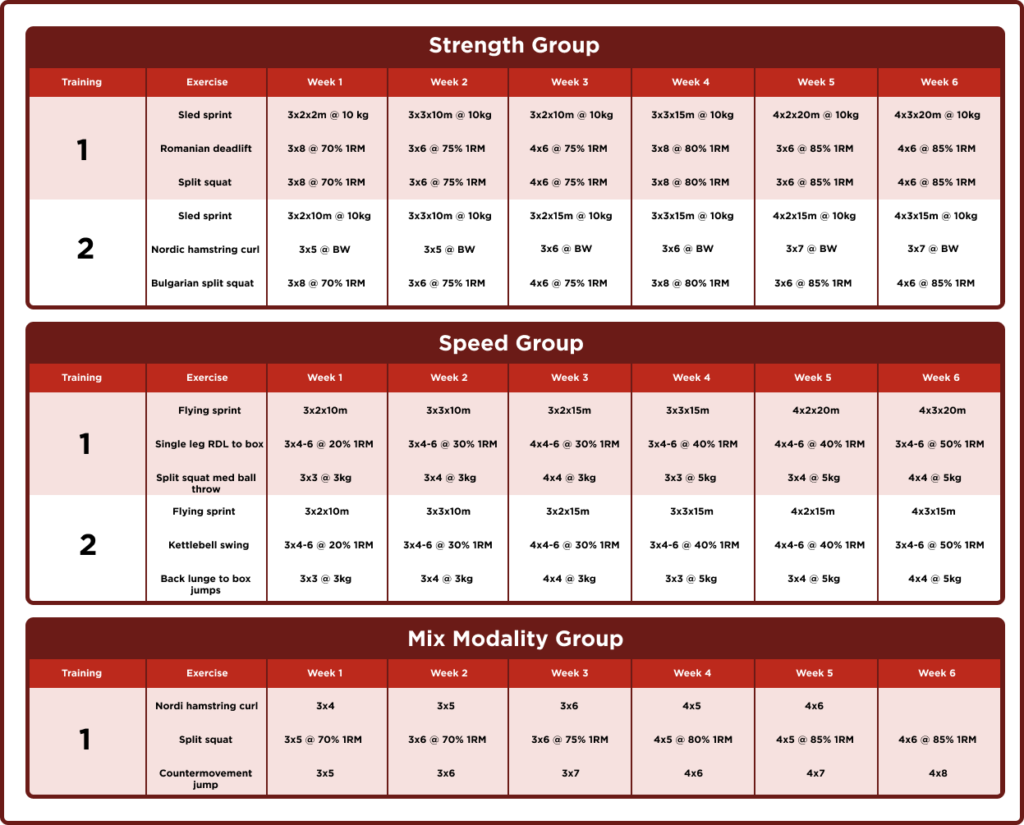
The intervention consisted of 2 sessions per week for 6 weeks, including the mixed-modality group. The sessions were supervised by the research team to ensure the proper execution of the program. Each program consisted of 3 exercises, performed in 3-4 sets (please see Table 1 for more details). Exercise intensity was controlled with % 1RM and properly progressed through the 6 weeks. Progression was made by lowering the reps in the set and increasing intensity of the reps.
Participants
For this study, we recruited a sample of 24 male professional youth soccer players (age: 17.6 ± 0.9 years; body height: 1.81 ± 0.06, body mass: 72.0 ± 8.1 kg), from two different age categories (U17 and U19). All the players are involved in regular soccer (minimum 5 training sessions per week) and resistance training (minimum 2 sessions per week) in the youth academy of a professional soccer club. The participants were excluded if they reported any musculoskeletal injuries, pain syndromes within the last year, and or any other medical conditions that could be exacerbated with the measurement procedure.
Participants were informed about the details of the protocol and were required to sign an informed consent prior to the beginning of the measurement. The protocol was conducted in accordance with the latest revision of the Declaration of Helsinki. The experimental procedures were reviewed and approved by Republic of Slovenia’s National Medical Ethic Committee (no. 0120– 690/2017/8).
Assessment
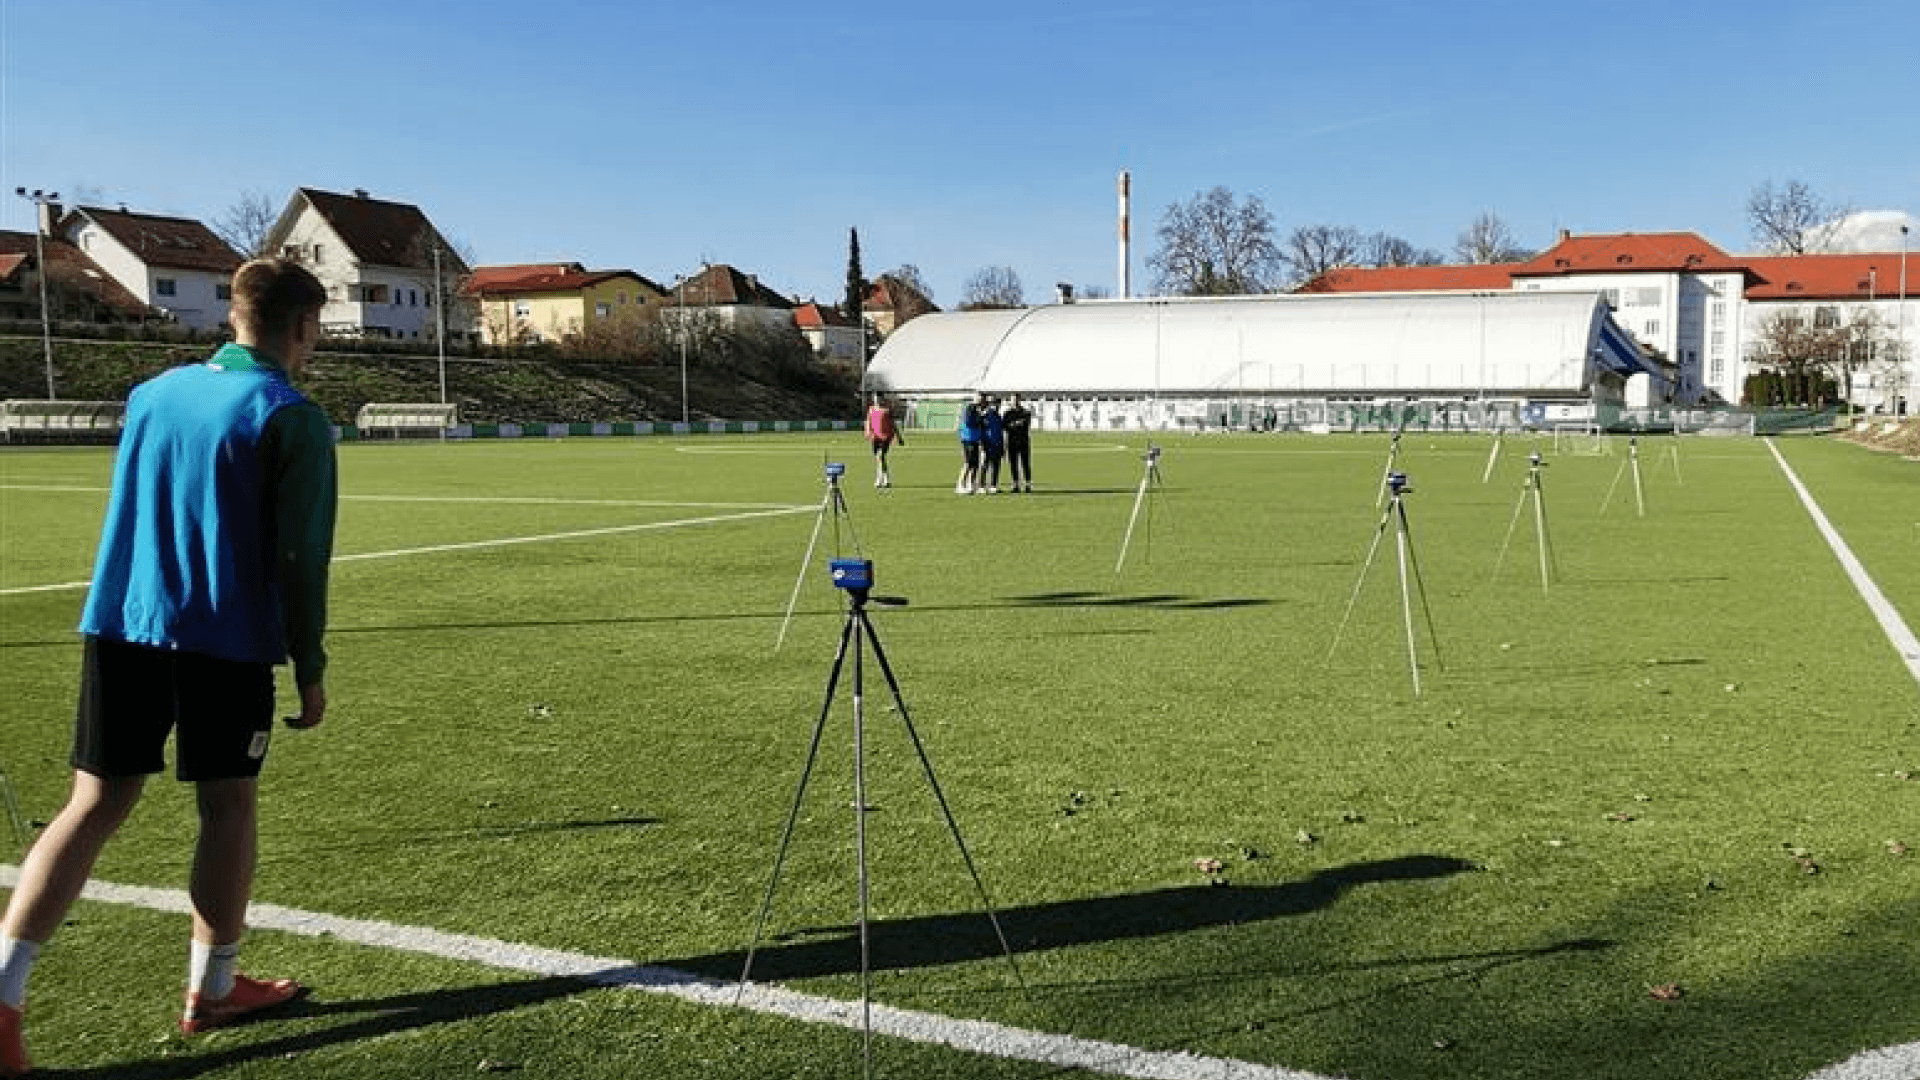
All the participants were instructed to prepare for the test days as they would for a normal training session and to use the same footwear and clothing each test day. They were also instructed to refrain from strenuous activity 48 h before testing. Prior to the warm-up, body mass was measured in training equipment. The assessments were performed on a soccer field. The participants performed a standardized warm-up, consisting of 10 min of light running, 5 min of dynamic stretching and 5 min of dynamic exercises to warm-up the main muscles for sprinting (lunges, horizontal jumps and accelerations). They also performed two warm- up sprints at the testing distance for activation purposes.
The participants had been routinely performing sprints over shorter distances and had been involved in similar testing procedures over the years of their training process, therefore no familiarization session was conducted. Sprint was assessed using five pairs of single-beam laser timing gates (Brower Timing Systems, Draper, UT, USA), which were positioned at the hip level and recorded the sprint split times to the nearest 0.001 second. Sprints were performed across 30 meters.
FVP profile was assessed based on the sprint split time data according to the method proposed by Samozino et. al. (2016). The participants began each sprint 30 cm behind the start line, to prevent early triggering. Therefore, we applied a correction of 0.5 s, as recommended in the literature (Haugen et al., 2012). A standing start was used, and subjects were free to choose their front leg, which was kept constant across repetitions. Subjects were instructed to sprint from the start line through all sets of timing gates as fast as possible. Three trials were completed and the breaks between the repetitions were set at 2 min.
Intervention
The participants engaged in an average of 10 hours of training per week, which consisted of 5 soccer sessions and 2 resistance training sessions. The intervention was performed in the preparation period of the soccer season, therefore only 1 friendly match per week was played during this time. The pre-test was completed one week before and the post-test was done one week after the intervention. Athletes underwent assessment at the same time of the day at both pre-and post-intervention periods. Each player performed a 30-m sprint test.
After the assessments, the participants were divided into the mixed-modality (n = 8; 70.6 ± 7.32 kg; 1.81 ± 0.05) and the intervention group, consisting of 2 sub- groups, the strength group (n = 8; 74.5 ± 10.2 kg; 1.80 ± 0.07) and the speed group (n = 8; 71.1 ± 7.00 kg; 1.82 ± 0.06).
The resistance training program consisted of 2 sessions per week, for 6 weeks (12 sessions altogether). The resistance training sessions were separated by a minimum of 48 hours to minimize the effect of neuromuscular fatigue. Due to the specificity of adaptation to contraction velocity (Cormie et al., 2011), strength programs focused on compound heavy load exercises (> 70% 1RM), at low contraction velocities and speed programs focused on moving the athletes body mass or low external loads (20-50% 1RM) at high contraction velocities. Both programs consisted of 3 exercises per training session and 6 exercises per week. Specifically, there were 6 multi-joint exercises, where both programs consisted of 2 unilateral exercises, 2 bilateral exercises and 1 sprint-based exercise.
Furthermore, the intervention group continued to perform their regular prevention and upper body exercises. During the intervention period, the mixed-modality group continued with their regular resistance training consisting of a combination of strength and ballistic exercises. Before the intervention, the research team trained the strength and conditioning coaches appointed to supervise the resistance training, to ensure proper execution of the exercises.
The intensity of the resistance exercises was prescribed and controlled with % of RM (which was regularly tested by strength and conditioning coaches to determine exercise intensity). Where we couldn’t use % RM, we used self-reported reps in reserve (RIR) with rep ranges that correspond to determined intensity (Helms et al. 2018). The players were already familiarized with using RIR, as this was regularly used in their teams. Training plans are presented in tables below.
Data Analysis
A method described by Samozino et. al. (2016) was used to assess the FVP profile of athletes. For each subject, the four split times at 0-5, 5-10, 10-20 and 20-30 m were used to determine the outcome measures of the FVP relationships. Split time data, body mass and body height, were used with the Excel templates designed based on Samozino’s simplified method (Samozino et al., 2016). Based on the measurement of a single sprinting action velocity-time data was gathered by photocells. After this, a mono exponential function was applied to the raw velocity-time data.
Horizontal force and velocity (Fh and Vh) were plotted to determine the force-velocity-power (FVP) relationship and its mechanical variables. Fh0 and Vh0 were plotted, as the interception of the y and x axis, respectively.
Maximal horizontal power (Phmax) was calculated as the interaction between Fh0 and Vh0. Additionally, the slope of the force-velocity (FV) relationship delineates the FV mechanical profile (SFV), indicating the individual balance between force and velocity attributes. Furthermore, this approach was employed to assess the mechanical effectiveness of sprinting, specifically the maximal ratio of horizontal-to-resultant force (RF). Additionally, a linear reduction in RF throughout the sprint was characterized as a decrement in the ratio of forces (DRF) (Morin et al., 2011).
Statistical Analysis
The data are presented as means ± standard deviations, minimum and maximum values. The normality of the data distribution for all variables was verified with Shapiro-Wilk test. Homoscedasticity was determined with Levene’s test. Training effects were evaluated using a mixed ANOVA with group (strength, speed and mixed-modality) as between-subjects factor and time (pre- and post- intervention) as within-subject factor. The effect sizes were determined using the partial eta-squared (η2) and were considered trivial (< 0.003), small (0.01), moderate (0.06), large (>0.154) (Lenhard & Lenhard, 2016).
Additionally, the Bonferroni- corrected post-hoc tests were performed in order to identify if significant changes occurred within each group, and the effect sizes were determined using Cohen’s d, which was interpreted as trivial (<0.10), small (0.40), moderate (0.70), large (>0.80) (Lenhard & Lenhard, 2016). Moreover, differences between pre-and post-intervention for each individual group were assessed with paired t-test. The threshold for statistical significance was set at α < 0.05 and all analyses were carried out in SPSS statistical software (version 25.0, IBM, USA).
Results
All participants performed 12 resistance training sessions throughout six weeks. At baseline, eight participants were allocated in the speed group, eight participants in the strength group and eight in the mix-modality group. Table 1 shows baseline data presented as mean, SD and range (minimum to maximum). Sprint at a 5m distance showed moderate reliability (ICC = 0.672), while sprint at 10m and 20m showed excellent relative reliability
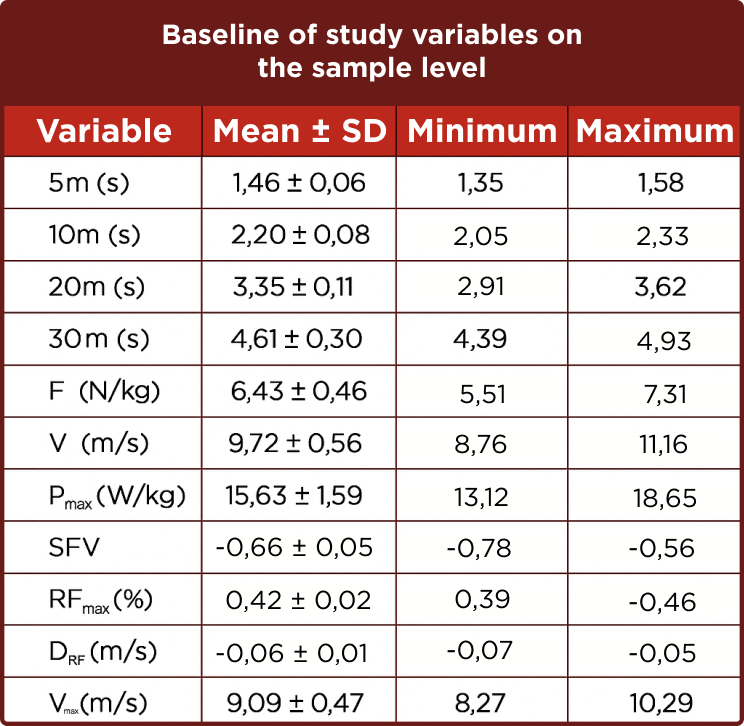
(ICC = 0.948-0.975) and 30m showed good reliability (ICC = 0.779). Absolute reliability was acceptable for all sprint distances (CV = 1.31-2.50).
Data for each group at pre-intervention and post- intervention time points and changes that occurred from pre-to-post-intervention are shown in Table 3. ANOVA did not show a significant group × time for any variable (p = 0.074-880). Furthermore, ANOVA was significant for time changes (differences between pre-and post-intervention) for all sprint distances (p = 0.000, η2 = 0.321-0.752) except for 20m (p = 0.633). The effect size ranged from small in 30m (Cohen’s d = -0.56-0.77) to large in 5m and 10m (Cohen’s d = 1.05-3.31) sprint split time.
Additionally, post-hoc test showed no differences between groups for any sprint distance. Regarding the FVP profile, all parameters showed significant differences between pre-and post-intervention (p = 0.000-0.049; η2 = 0.170-0.730), except for Vh0 and Vmax (p = 0.339-0.973). Large effect sizes were observed across all groups in Fh0, Pmax, SFV, RF, and DRF, with Cohen’s d ranging from -3.38 to 3.50, with slightly higer values in the mix modality group. Moreover, post-hoc test showed significant differences between the mixed-modality group and strength group for Pmax and RF (p = 0.013-0.026).
Discussion
The main purpose of the present study was to compare the effects of strength and speed resistance training programs on physical performance variables derived from the sprint FVP profile of professional youth soccer players. To our knowledge, this represents the first investigation into how strength and speed-based training interventions affect FVP profile in this population. The main finding of the current study was that regardless of the training protocol, youth soccer players improved their sprinting capabilities (i.e. sprint times) throughout the 6-week training period.
Furthermore, we saw an improvement in FVP profile variables (Fh0, Phmax, SFV, RF and DRF) in all the experimental groups. Moreover, the strength group tended to a greater improvement in RF and Phmax compared to the mixed-modality group. Lastly, no group presented a significant change in Vh0 and Vmax.
Split times for 5m, 10m and 30m improved across all three training groups without any significant difference among them. The results could be interpreted in two ways: a.) improvement in speed necessitates adequate volume and intensity of resistance training, and b.) combining soccer training with FIFA 11+ program can effectively stimulate speed adaptation in youth soccer players. Our findings agree with the results of the previous studies.
Hammami et al. (2018, 2019) reported that elite young soccer players who performed strength training twice per week for 8 weeks significantly improved their 5m, 10m, 20m, 30m (p ≤ 0.001), and 40m (p ≤ 0.05) sprint times, while the mixed- modality group, which maintained their regular soccer training program, showed no improvement (p > 0.05). Additionally, Hammami et al. (2019) also observed a significant 7% and 6% decrease in 10m and 20m sprint times (p ≤ 0.05), respectively, after 8 weeks of traditional resistance training in young soccer players. Furthermore, García-Pinillos et. al.
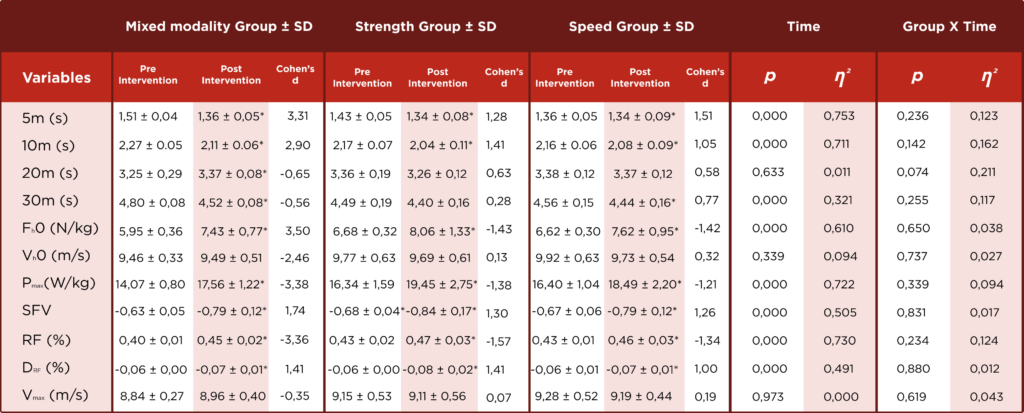
m = meters; s = seconds; Vh0 = maximal theoretical velocity; Pmax = maximal power; SFV = force-velocity profile slope; RF = ratio between vertical and horizontal ground reaction force; DRF = decrease in ratio of force; Vmax = maximal velocity; * = statistically significant difference between pre and post results.
(2014), performed a 12-week-long intervention program with youth soccer players, where they did contrast training, combining isometric and plyometric exercises. They reported a significant decrease in 5m, 10m, 20m and 30m sprint time performance (p ≤ 0.05). Norgeot & Fouré (2024) compared the effects of 8 weeks of vertical and horizontal plyometric training in youth soccer players.
Both training groups experienced significant reductions in 5m, 10m, 15m, and 30m sprint times (p ≤ 0.05). In conclusion, the results of the previous literature in combination with ours, suggest that the combination of resistance exercises, along with moderate volumes of sprint work through soccer training, are sufficient to enhance athletic performance in youth soccer players.
This study provides compelling evidence that after 6-weeks of resistance training the FVP profile of youth soccer players changes, regardless of the training type. We report statistically significant improvement in Fh0, where there was no change in Vh0. This could be due to the maturational status and specific physical capabilities of our subjects, who predominantly engage in soccer training emphasizing velocity-oriented exercises.
At baseline, all training groups in the present study predominantly consisted of velocity- dominant soccer players (Samozino et al., 2014). This could mean that the subjects had a larger “window of opportunity” for the improvement in force rather than velocity capabilities. Furthermore, youth soccer players at this age are in a sensitive phase of strength development (Moran et. al., 2017, Peña- González et. al, 2019).
Thus, the improvements seen here could be due to a range of neurological adaptations during the early stages of training (e.g., increased muscle activation and rate coding) (Aagaard et al., 2002), which favor the improvement of Fh0 (Fernández-Galván et. al., 2022, Otero-Esquina et. al. 2017). Furthermore, the higher values of Fh0 and SFV with a concurrent increase in Phmax in post-intervention phase could mean that resistance training (no matter the type) in this age group, favourably affects FVP profile variables and sprint performance. Our study aligns with Lindberg et al. (2021), who also found that training towards an optimal force-velocity profile
is as effective for improving athletic performance as training without consideration for the athlete’s initial profile. Furthermore, Lahti et. al. (2020), report that after 8 weeks of resisted or assisted sprint training, both groups shifted their FVP profile to a more optimal state. However, only the resisted group showed statistically significant improvement in their 20 m sprint time and Fh0. In contrast to our study, there was no difference in Phmax post-intervention. In line with research conducted by Norgeot & Fouré (2024), who implemented eight weeks of plyometric training (horizontal versus vertical) with a youth elite soccer team, findings indicate comparable outcomes regarding the alteration of FVP variables.
Regardless of the plyometric training type, participants demonstrated enhancements in Fh0, Phmax, and RFmax. However, the absence of a control group in their study leaves room for speculation that the observed improvements might solely stem from soccer training. Nevertheless, more studies are needed to determine potential effects of FVP profiles for navigating training to improve physical performance.
Additionally, we report that all three training groups improved their effectiveness of force application from PRE to POST. This can be seen as an improvement of RF (the percentage of the total force generated that is applied horizontally) and DRF (the decrease in the ratio of horizontal-to-resultant force). This is an important factor for successful performance in soccer, as studies show that the technical ability, rather than the capability to produce force is related to the overall sprint performance (Morin et al., 2011). RF improvement arises from optimizing the angle and technical skill with which horizontal force, relative to the total ground reaction force, is applied during the support phase (Hicks et. al., 2023)
Consequently, maintaining the same magnitude of force applied to the ground leads to an improved horizontal change in velocity during the stance phase, attributed to the orientation of the ground reaction force vector (Bezodis et. al., 2021). In contrast, there was no difference between the speed group and the mixed-modality group. It’s possible that the combination of soccer practice and mixed modality resistance training (in our case FIFA 11+ program) provided enough stimulus for enhancing horizontal force production capabilities in academy soccer players.
Limitations
One limitation of this study is the relatively small sample size, which may impact the generalizability of the findings and the ability to detect statistically significant differences with a typical alpha level of 0.05. While we utilized effect sizes as an additional measure to assess the practical significance of the results, the small sample size may limit the robustness of these findings.
Furthermore, the potential for underpowered statistical tests due to the sample size could lead to an over-reliance on p-values, which may obscure meaningful effects. Future studies with larger sample sizes would be beneficial to more comprehensively evaluate the intervention’s effects and ensure the reliability of the conclusions drawn. Moreover, we did not consider the biological age of our participants.
Recognizing the biological age of athletes could be crucial, particularly within this age range characterized by significant variability in maturational status. These variations are linked to diverse hormonal responses to a given stimulus. Hence, understanding the athlete’s biological age is imperative for tailoring the training stimulus effectively. Our study did not include a control group that would only participate in soccer training, as the club’s vision is to develop players’ physical performance through resistance training across all age groups.
Furthermore, due to the small selection of performance tests we could have overlooked some important aspects of performance. With fewer tests, the study may fail to capture the full spectrum of abilities within the measured variables, reducing the overall comprehensiveness of the findings. Therefore, the findings should be interpreted with caution due to the limitations.
Conclusion
The results of this study indicate that incorporating speed-focused, strength-focused, or a combination of these two resistance training modalities can enhance sprinting speed and mechanical capabilities in youth soccer. This improvement is indicated by the decrease in sprint split times observed following the training intervention. Over a 6-week period of resistance training, all three groups exhibited improvements in their Fh0, with no notable change in Vh0.
Additionally, enhancements in mechanical sprinting capabilities were observed across all groups, as indicated by improvements in Phmax, RF and DRF variables. Our findings revealed improvements across all groups following the intervention. Interestingly, there was no significant change in the velocity component, suggesting that soccer players may have greater potential for improving their force production capacity, while their velocity capabilities appear to be already well-developed through soccer practice. Further research should explore the impact of maturational status on training efficacy to optimize individualized training approaches.
References
https://journal.iusca.org/index.php/Journal/article/view/392/448