
So you decide to take it on a run and your wish is to line up for a 10K. Your success isn’t only determined by the legs, it’s written in the rhythm of the heart. The way the heart beats, adapts, and recovers reflects the entire story of endurance performance.
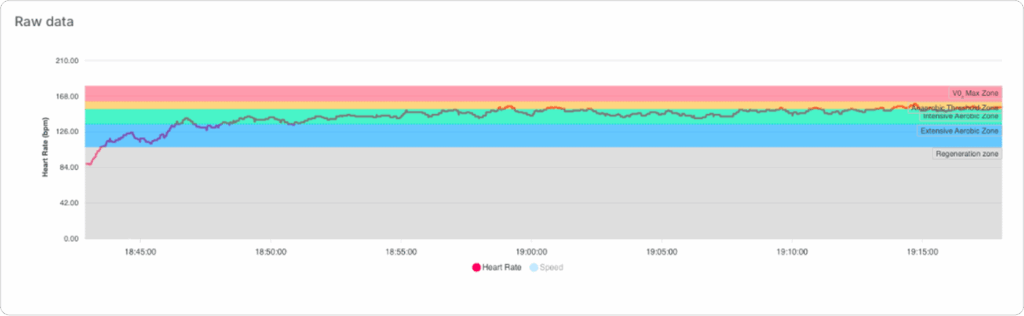
Heart rate (HR) (Figure 1) is more than a number flashing on a watch. It’s the body’s internal GPS showing how hard the cardiovascular system is working to deliver oxygen, clear carbon dioxide, and fuel muscle contraction. Understanding how HR adapts through training helps runners train smarter, not harder.
This article dives deep into how your heart learns to run a 10K, connecting the science of cardiovascular adaptation with practical programming. You’ll learn how to use HR, HR Reserve, and the 5-minute MAS time trial to personalize your training zones, and finish with a 14-week HR-based plan that turns science into real-world performance.
The Physiology Behind Heart Rate in Running
Every beat of your heart drives blood through an intricate network that transports oxygen from the lungs to the muscles and returns carbon dioxide back to the lungs. This system, the cardiorespiratory network, is the foundation of aerobic endurance.
When you start running, your muscles demand more oxygen. To meet this, the heart rate (HR) and stroke volume (SV) rise, increasing cardiac output (Q = HR × SV) the total blood pumped per minute. The oxygen uptake (VO₂) mirrors this, increasing almost linearly with HR up to near maximal intensities.
At low and moderate intensities, HR and VO₂ rise together in a predictable line. However, once you approach your lactate threshold, oxygen delivery begins to plateau while HR keeps climbing signaling the body’s transition toward anaerobic metabolism.
With consistent endurance training, this system remodels:
- The left ventricle enlarges, allowing a greater stroke volume.
- Resting HR decreases, indicating parasympathetic dominance.
- Submaximal HR at a given speed becomes lower, reflecting improved efficiency.
- Recovery HR quickens, showing faster autonomic reactivation.
In short your heart becomes stronger, more economical, and more responsive.
These long-term changes are central to 10K success, where athletes must sustain 85–90% of HRmax for 40–60 minutes with minimal cardiovascular drift.
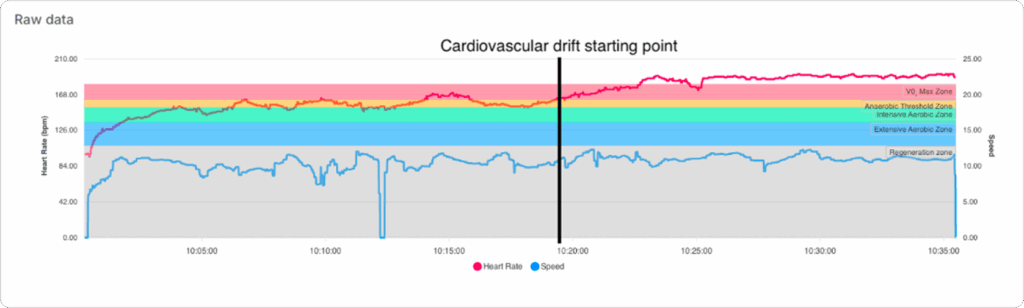
Cardiovascular drift (Figure 2) refers to the gradual increase in heart rate (HR) that occurs during prolonged, steady-state exercise even when the running pace and overall workload remain constant. It’s one of the most important internal markers coaches should understand when analyzing endurance sessions.
During the first 10–20 minutes of continuous running, heart rate and stroke volume (the amount of blood ejected per beat) stabilize. But after 20–30 minutes especially in warm or humid conditions a slow, progressive rise in HR (typically 5–20 bpm) is often observed, even though running speed and VO₂ stay the same.
What causes the drift in our body? To understand it better there are 4 physiological shifts that must be explained:
- Reduced plasma volume:
Sweat loss decreases blood volume, which reduces venous return to the heart. With less blood returning, stroke volume falls slightly.
- Compensatory HR increase:
To maintain cardiac output (Q = HR × SV), the body compensates for the smaller stroke volume by increasing HR.
- Increased skin blood flow:
As body temperature rises, more blood is directed toward the skin for cooling. This redistribution means slightly less blood is available for the working muscles, forcing HR to climb to maintain oxygen delivery.
- Hormonal and autonomic effects:
Over time, sympathetic activation (adrenaline) stays elevated, while parasympathetic influence decreases contributing to a higher steady HR.
Although cardiac output (Q) and oxygen uptake (VO₂) remain relatively constant, the heart must beat faster to achieve the same delivery. This makes HR a less precise indicator of true metabolic intensity during long, hot, or dehydrated sessions. A runner might start a 60-minute tempo run at 150 bpm (≈80% HRmax). After 40 minutes, even if the pace is unchanged, HR may rise to 160 bpm. This does not mean the runner suddenly increased effort, it’s cardiovascular drift in action.
What we can do about cardiovascular drift?
- Hydration: Adequate fluid and electrolyte intake minimizes plasma volume loss.
- Temperature control: Training in cooler environments or adjusting pace in heat reduces drift.
- Training adaptation: Well-trained athletes show less drift due to improved thermoregulation and higher stroke volume.
- Monitoring: When HR drift exceeds 5–10 bpm in steady sessions, it often signals fatigue, dehydration, or insufficient aerobic conditioning.
To summarize in simple terms: cardiovascular drift is the heart’s way of keeping oxygen delivery constant when environmental or internal factors make the job harder. A smaller drift over time is a clear indicator that your heart has adapted it’s stronger, more efficient, and better at regulating blood flow and temperature during sustained 10K efforts.
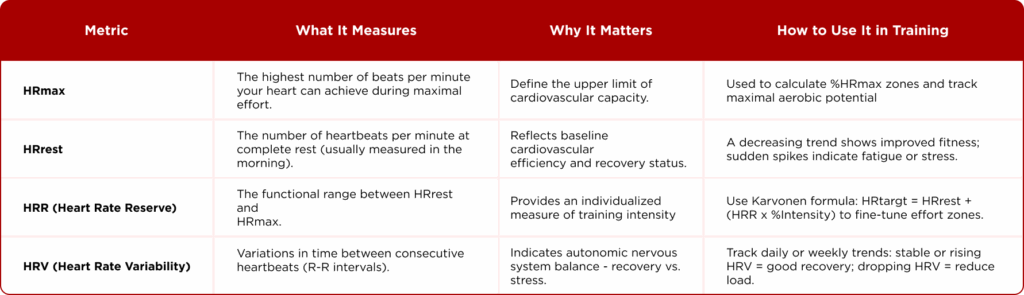
Understanding Heart Rate Metrics
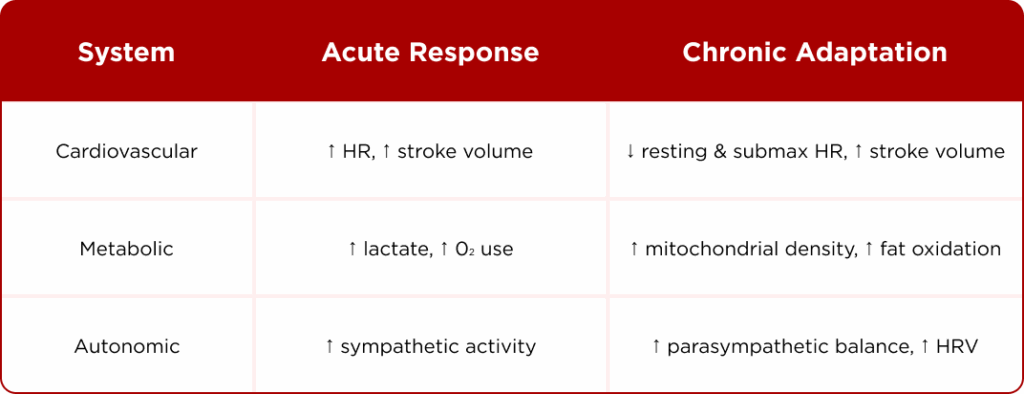
To effectively design training and monitor progress in a 10K running program, we first need to understand the key heart rate metrics (Table 2) used in modern heart rate monitoring.
a) Maximum Heart Rate (HRmax)
The highest heart rate your body can achieve during maximal effort.
For a 35-year-old recreational runner, a realistic HRmax ≈ 180 bpm.
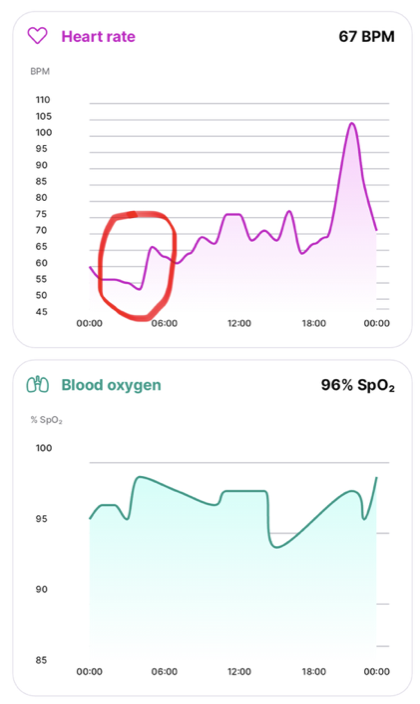
b) Minimal Heart Rate (HRmin)
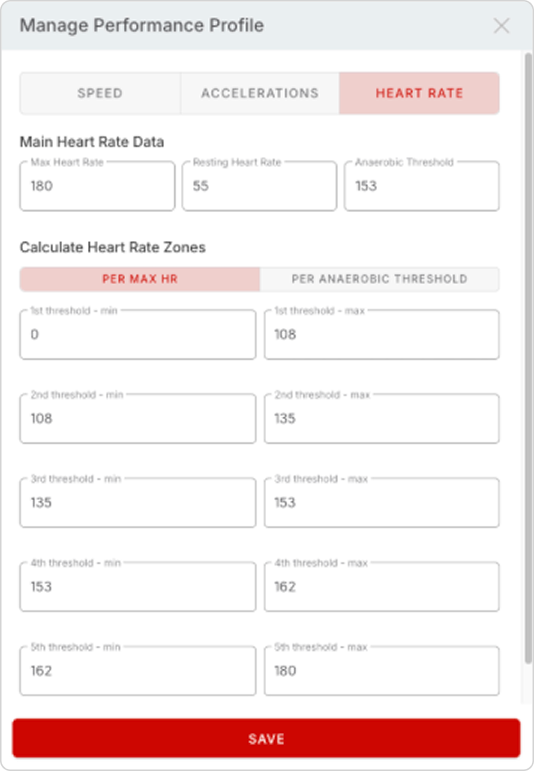
Measured upon waking in a calm, seated or supine position.
Well-trained runners often record 45–55 bpm, while beginners average 60–70 bpm.
Lower resting HR indicates a stronger, more efficient heart and dominant parasympathetic (rest-and-recover) activity (Figure 3).
c) Heart Rate Reserve (HRR)
HRR reflects the functional range of your heart between rest and maximum effort.
It provides a more individualized measure of exercise intensity by factoring in both HRmax and HRrest.
Formula:
𝐻𝑅𝑅=𝐻𝑅𝑚𝑎𝑥−𝐻𝑅𝑟𝑒𝑠𝑡
To find a training target:
Target\ HR = HR_{rest} + (HRR \times \text{%Intensity})
Example:
If HRmax = 180 bpm and HRrest = 55 bpm, HRR = 125 bpm.
- 70% intensity → 55 + (125 × 0.70) = 142 bpm
- 85% intensity → 55 + (125 × 0.85) = 161 bpm
The HRR method adjusts for individual differences in resting HR and usually aligns better with perceived effort, especially during longer runs or training in hot conditions.
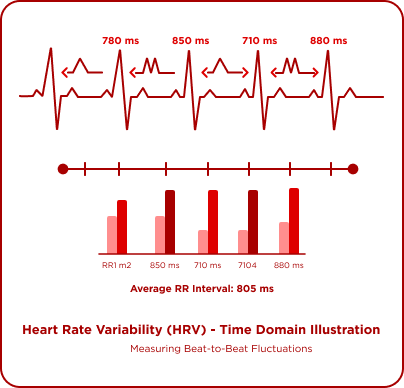
d) Heart Rate Variability (HRV)
Heart Rate Variability (HRV) (Figure 4) measures the small, natural fluctuations in time between consecutive heartbeats known as R-R intervals.
Rather than assessing how fast your heart beats, HRV shows how well it adapts to internal and external stress.
What HRV Reflects
HRV is controlled by the autonomic nervous system (ANS) specifically, the balance between its two branches:
- Parasympathetic (vagal) activity: promotes recovery, lowers HR, increases HRV.
- Sympathetic activity: drives stress and exertion, raises HR, decreases HRV.
A high HRV value (greater variability between beats) generally indicates good recovery, adaptability, and parasympathetic dominance.
A low HRV value suggests accumulated stress, fatigue, dehydration, or insufficient recovery.
How to Measure HRV
Modern HR monitors and smartwatches estimate HRV from resting or overnight recordings (most use the rMSSDmetric — the root mean square of successive differences between R-R intervals).
For accuracy, measure HRV daily at the same time, ideally right after waking and before caffeine or activity.
Why HRV Matters for Runners
Tracking HRV helps runners and coaches gauge readiness:
- Stable or rising HRV → body is adapting well to training.
- Sudden HRV drop (>10–15%) → possible overreaching or illness.
- Low HRV + elevated resting HR → recovery day advised.
When used alongside HRrest and HRR, HRV provides a third dimension of insight — it captures the autonomic recovery status that pure heart rate data can’t show.
In Practice
- Record HRV each morning using a chest strap or optical sensor.
- Compare 7-day rolling averages rather than single-day values.
- Use HRV trends, not numbers, to adjust your training load.
Over time, improving endurance fitness and sleep quality will both raise baseline HRV — a powerful sign that your cardiovascular system is becoming more resilient.
How the Heart Adapts to 10K Training
No matter what type of training we do, the body always adapts. Every repeated effort from easy runs to high-intensity intervals triggers specific physiological changes that prepare the heart and muscles to handle the demands of running a 10K more efficiently.
Central Adaptations (The Engine)
- Cardiac hypertrophy: the heart muscle enlarges, increasing stroke volume.
- Improved diastolic filling: the heart refills faster between beats.
- Enhanced parasympathetic tone: lower HR at rest and faster recovery.
Peripheral Adaptations (The Fuel Lines)
- More capillaries in muscles → improved O₂ delivery.
- Greater mitochondrial density → increased aerobic energy capacity.
- Enhanced lactate clearance → higher sustainable pace before fatigue.
Functional Outcomes
- Lower HR at a given pace.
- Reduced cardiovascular drift over long runs.
- Faster HR recovery post-training.
- Improved ability to sustain 85–90% HRmax during race conditions.
Training Zones: %HRmax and %HRR
By using both maximum heart rate (HRmax) and heart rate reserve (HRR), we can accurately determine individualized training zones that guide intensity, optimize adaptation, and ensure each session targets the right physiological system (Table 4).
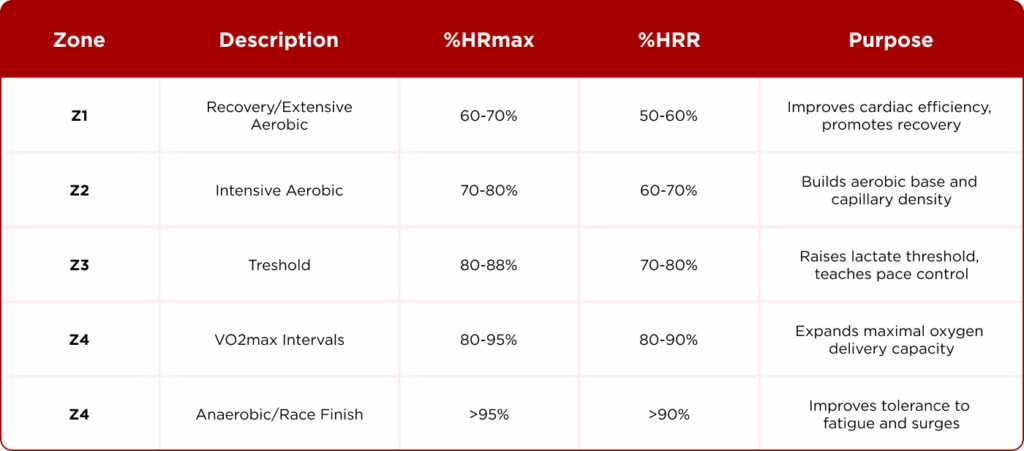
When we use both scales that approach ensures accuracy: %HRmax gives general guidelines, while %HRR refines intensity for individual variation.
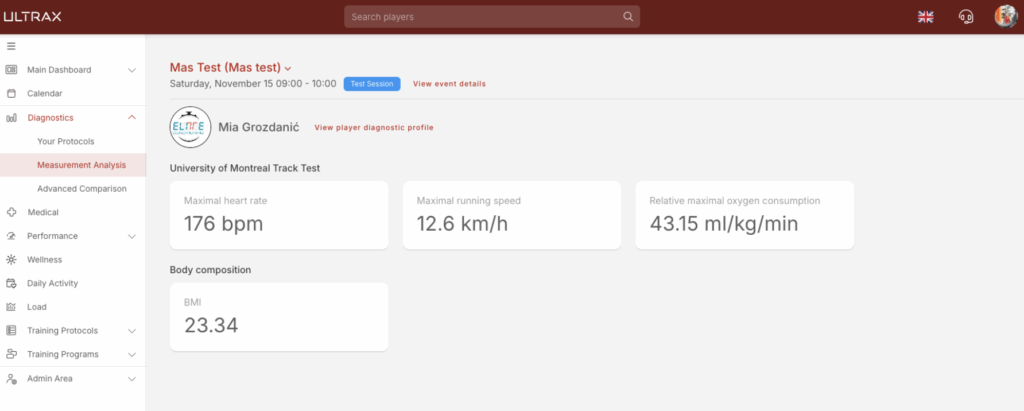
Determining Running Intensity: The MAS 5-Minute Test
What Is MAS?
MAS (Maximal Aerobic Speed) is the lowest running speed at which VO₂max occurs. It’s a practical benchmark for endurance training intensity.
Why Use a 5-Minute Time Trial?
Laboratory VO₂max testing is precise but impractical for most recreational athletes. A 5-minute maximal run is a valid field test that closely predicts VO₂max speed (Figure 5).
How to Perform It:
- Warm up 10–15 min with progressive strides.
- Run as far as possible in 5 minutes at a consistent maximal effort.
- Record total distance (e.g., 1,350 meters).
- Calculate MAS = distance ÷ 300 seconds → 1,350 ÷ 300 = 4.5 m/s (16.2 km/h).
Use of MAS in Training:
Training speeds are expressed as percentages of MAS (Table 3), corresponding roughly to HR zones:
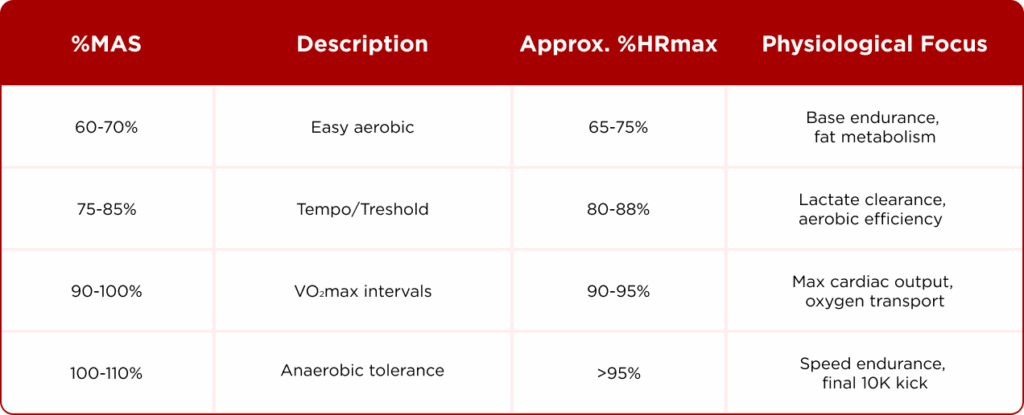
Combining MAS with HR allows a double control: external load (speed) and internal load (HR response) the gold standard for individualized endurance programming.
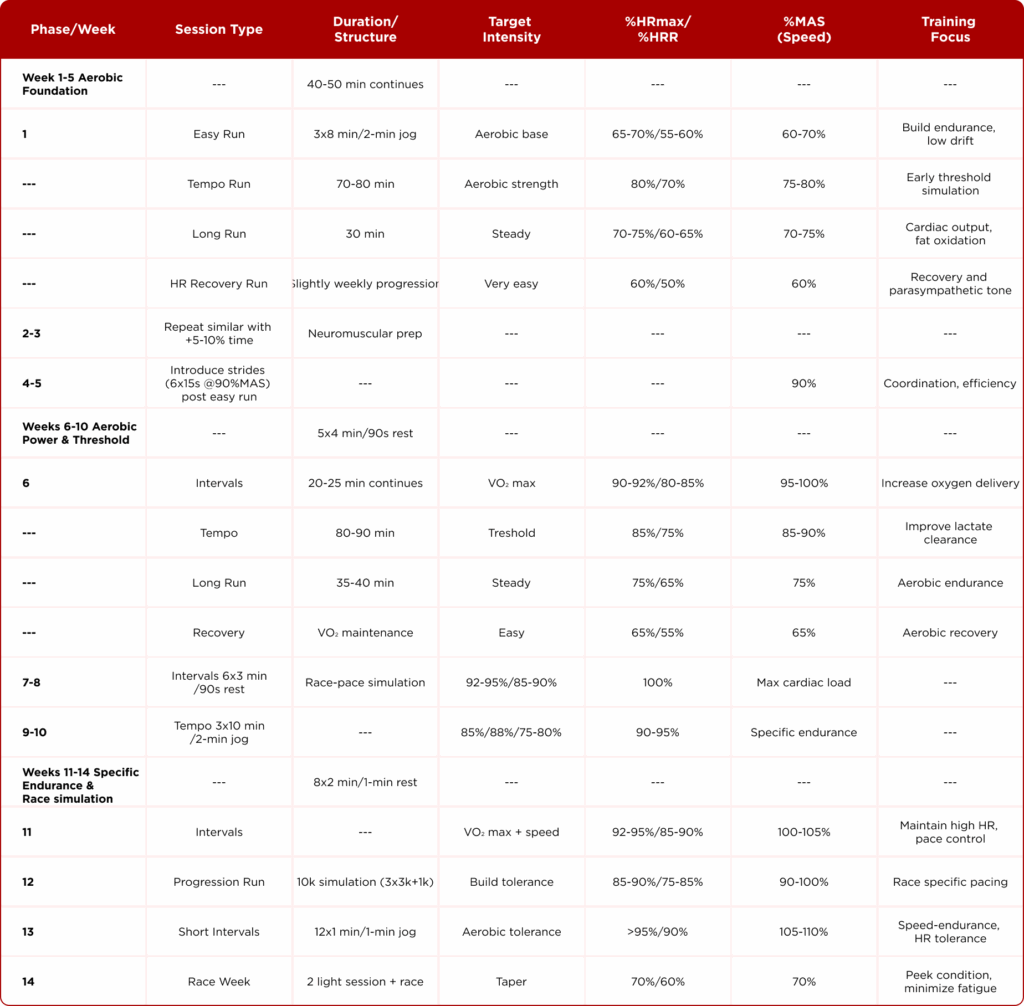
The 14-Week HR-Based 10K Training Plan (4 Days/Week)
Now that we understand what the heart needs to function efficiently and how it responds during running, it’s time to put that knowledge into action with a 14-week training program (Table 5) designed to apply all these principles in practice.
Overview
This 14-week plan develops the heart systematically through three progressive phases:
- Aerobic Foundation (Weeks 1–5) – build base endurance and strengthen cardiac output.
- Aerobic Power & Threshold (Weeks 6–10) – raise VO₂max and increase sustainable pace.
- Specific Endurance & Race Simulation (Weeks 11–14) – integrate speed, threshold, and race pacing.
Assumptions:
- HRmax = 180 bpm
- HRrest = 55 bpm
- HRR = 125 bpm
- Example MAS = 16 km/h (based on 5-min test = 1,333 m distance)
Notes on Application
- Session Frequency: 4 per week; add optional mobility or strength sessions on non-running days.
- Intensity Control: Use HR monitor + pace from MAS test; adjust if fatigue or drift >5 bpm above target.
- Recovery Check: Morning HR or HRV trends; if resting HR is elevated by >6 bpm, reduce intensity that day.
- Progression: Every 4–5 weeks, retest MAS or note HR at tempo pace — improvement shows cardiovascular adaptation.
Monitoring and Adjusting Load
Effective endurance coaching balances external load (speed, distance) with internal load (HR, RPE, and physiological stress).
a) Heart Rate Recovery (HRR1min)
After intervals or races, measure how much HR drops in 60 seconds:
- >30 bpm → well-conditioned
- 15–25 bpm → moderate fatigue
- <15 bpm → insufficient recovery
b) Heart Rate Variability (HRV)
HRV reflects the balance of the autonomic nervous system. Higher variability (especially morning rMSSD) indicates readiness and strong parasympathetic function.
c) Subjective Rating of Perceived Exertion (RPE)
Integrates cardiovascular, muscular, and psychological load.
In 10K preparation:
- Easy runs ≈ 3–4/10
- Tempo runs ≈ 6–7/10
- Intervals ≈ 8–9/10
Putting It All Together
A successful 10K program doesn’t just strengthen your legs it completely reprograms your heart. Over 14 weeks, your cardiovascular system learns to work smarter, not harder, it pumps more blood with every beat, delivers oxygen more efficiently, and recovers faster after each effort. With every run, your heart becomes more resilient, more responsive, and better synchronized with your body’s rhythm, learning not just to endure the distance, but to truly run it:
- Pump more blood with fewer beats (↑ stroke volume).
- Recover faster (↑ parasympathetic activation).
- Maintain steady HR for longer at race pace (↓ drift).
- Handle higher intensities without redlining too early.
The result? A heart that not only endures the distance but thrives in the rhythm of running.
Conclusion
Running 10 kilometers isn’t just a test of willpower it’s a continuous dialogue between your muscles and your heart. When you train that dialogue with precision, your heart doesn’t merely beat stronger; it learns to run in harmony with you. Heart rate becomes your internal compass, revealing how your body truly responds to training load. By using Heart Rate Reserve (HRR), you can fine-tune intensity more precisely than with %HRmax alone, while the simple 5-minute MAS test offers recreational runners an accurate, field-based way to individualize their training paces. In the end, quality always outweighs quantity, four purposeful sessions a week are enough when guided by sound physiology. Remember, adaptation takes time, monitor your trends (Figure 6), respect recovery, and your heart will repay you with lasting endurance, greater efficiency, and ultimately the ability to run faster than ever before.
Scientific Sources
Bok, D. (2019). Visoko-intenzivni intervalni trening: čaroban trening za zdraviji život. Medicus.
Bok, D. (2021). Dinamika akutnog fiziološkog odgovora na različita opterećenja. Konferencija KPS.
Bok, D. (2022). An examination and critique of subjective methods to determine exercise intensity.
Bok & Foster (2021). Applicability of field aerobic fitness tests in soccer: which one to choose?
Buchheit, M. & Laursen, P. B. (2013). High-Intensity Interval Training: Solutions to the Programming Puzzle, Parts I & II. Sports Medicine.
Bok, D. (2019). Praćenje opterećenja u treningu izdržljivosti. Kineziološki fakultet, Zagreb.
Foster, C., et al. (2001). A new approach to monitoring exercise training. J Strength Cond Res.