
A year ago, I started studying at a Football Science institute, a masters in football injury reconditioning coach. In one module, professor Jo Clubb began to explain the importance of assessments and what we need to take into account when choosing a test and what are the arguments for and against using screening protocols. I immediately knew that this is going to be a useful presentation and that we all need to have a critical approach when it comes to our decision making process. In this article, I will share what she had to say about screening assessment. Starting with her arguments for and against screening, and what is my personal conclusion on the topic.
Arguments against
Why screening test for preventing injuries never works and probably never will?
“Is it possible to use screening test to identify who is at risk for a hamstrings or ACL injury in order to address the deficit through a targeted intervention programme”?
(Bahr,R.,2016.)
When addressing injury screening we want to look at factors that are associated with the injury. Screening tests are usually used to recogniz some of these factors that influenced the injury happening in the first place. The goal of coaches and sport professionals after screening is to intervene and address the discovered deficits with an intervention program. The main goal of performing such a test is to discover early signs of illness, risk factors or diseases. The data gathered is usually continuous data. To understand how we are collecting the data we first need to talk some statistics (Jo Clubb, FSI course) (program2).

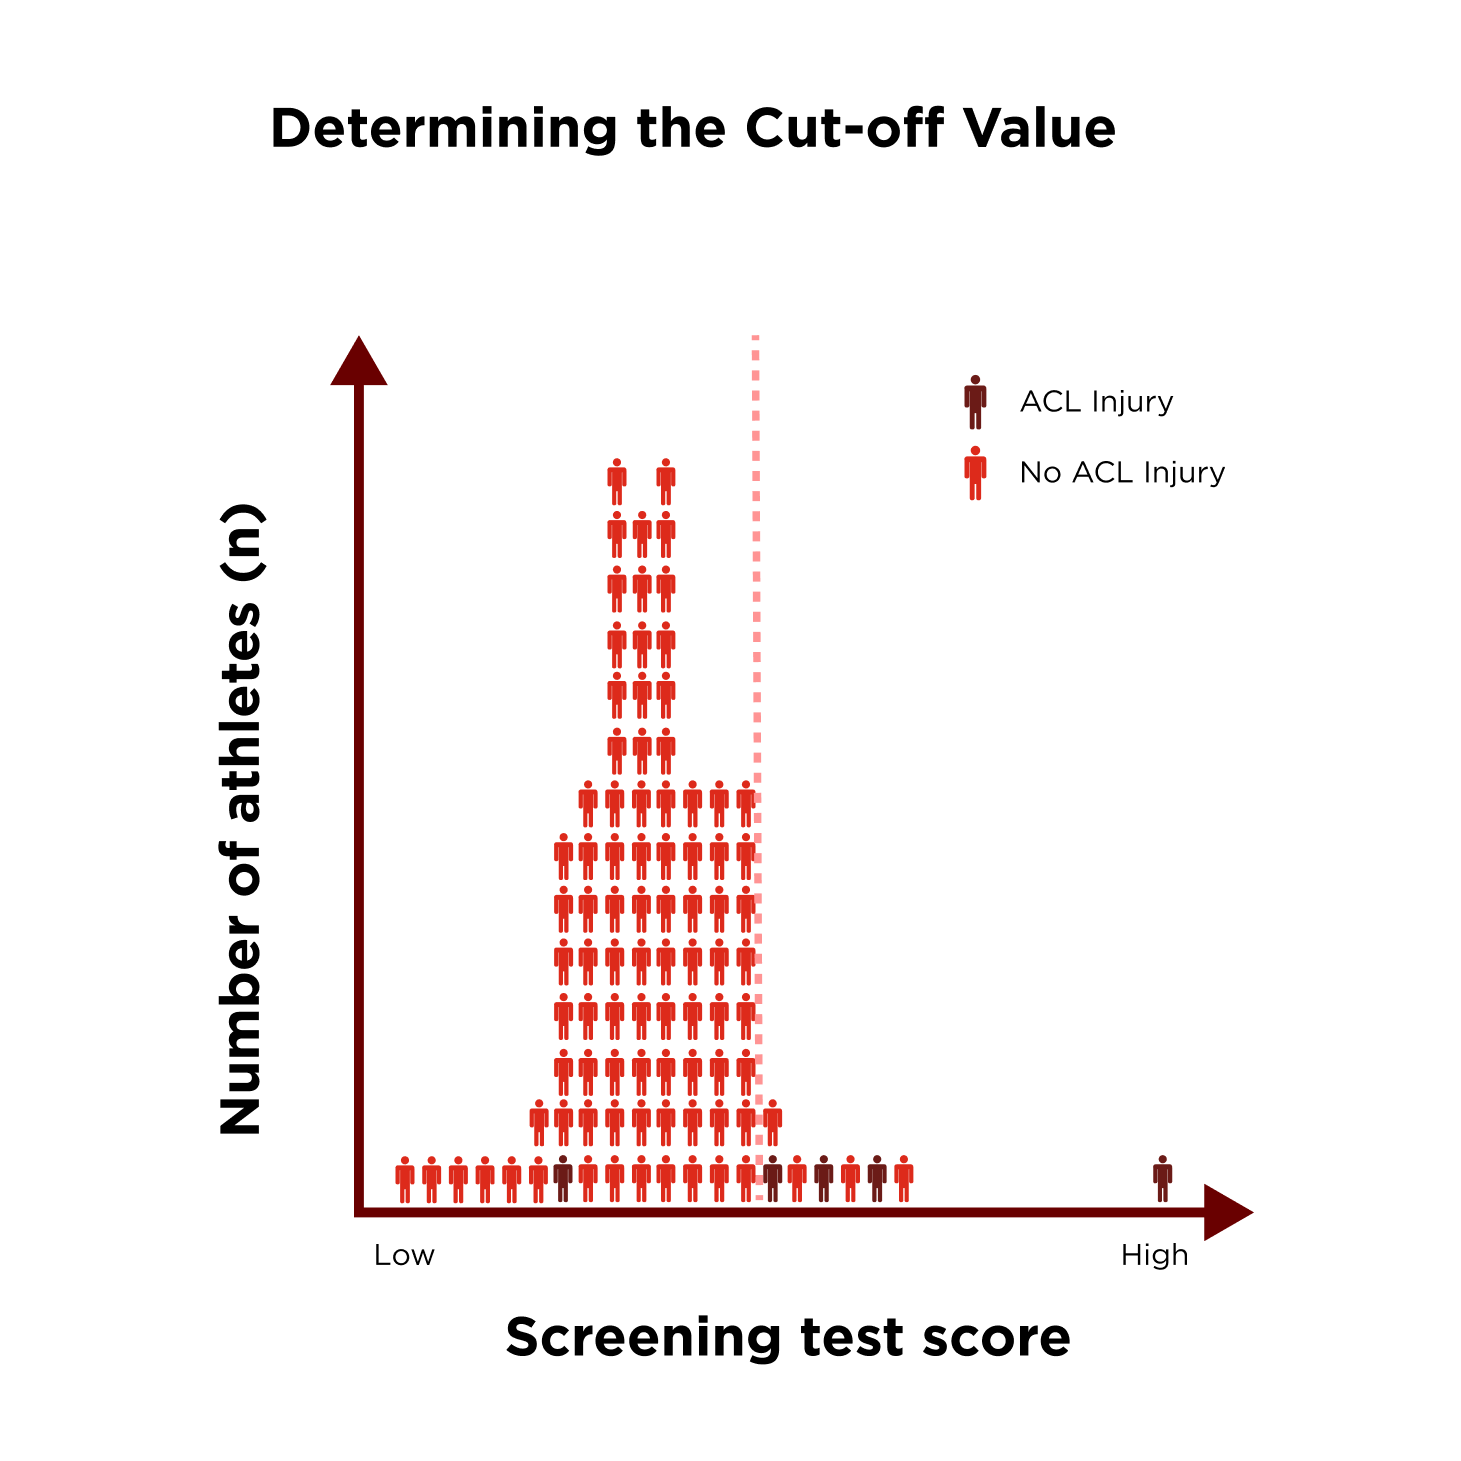
Let’s talk a little bit about statistics
In the example above, you can see that there are athletes on y axis and on the x axis screening test score. This example can be used for any test, for example let’s take a strength test. Most athletes scored in the middle. The challenge here is where to put a cut off value to know what are the good results, and which athletes are at low or high-risk scores. We need to understand statistics that measure the performance of binary classification test (2). For this scenario, we use Sensitivity or true positive rate (for example, a proportion of injured athletes correctly classified as being injured). We can also remember this as the proportion of pregnant women correctly classified as being pregnant by using a pregnancy test. On the other hand, we have specificity, the proportion of uninjured athletes correctly classified as not being injured a.k.a. true negative rate.
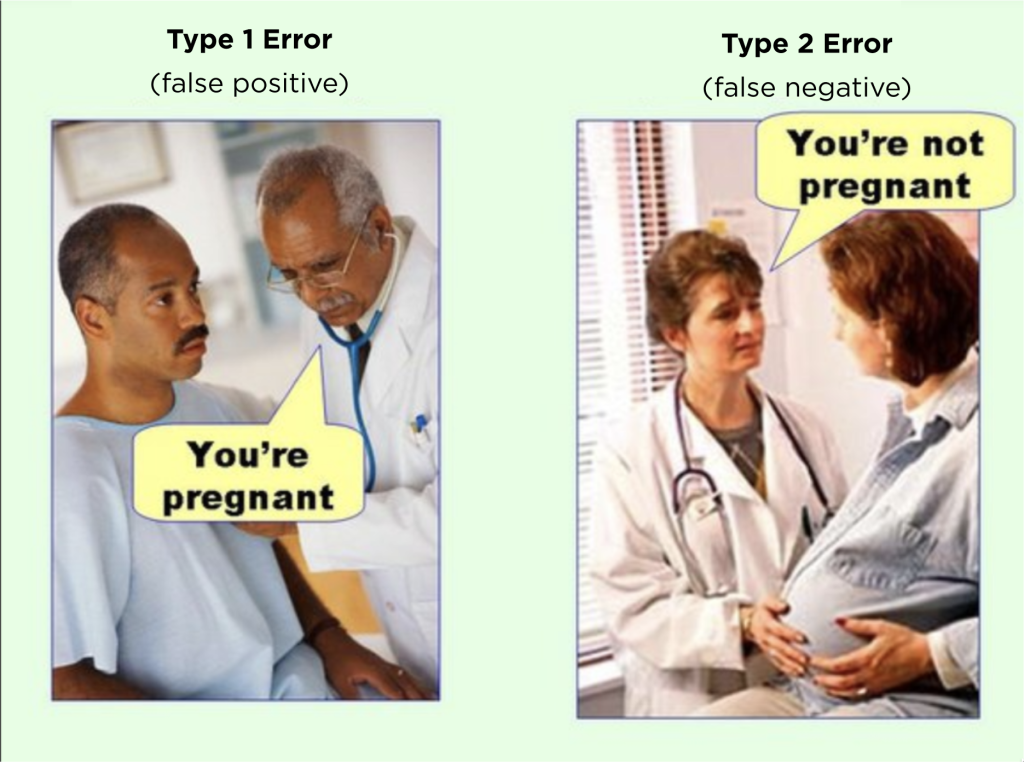
In this case we use Sensitivity or true positive rate (for example, a proportion of injured athletes correctly classified as being injured). We can also remember this as the proportion of pregnant women correctly classified as being pregnant by using a pregnancy test.
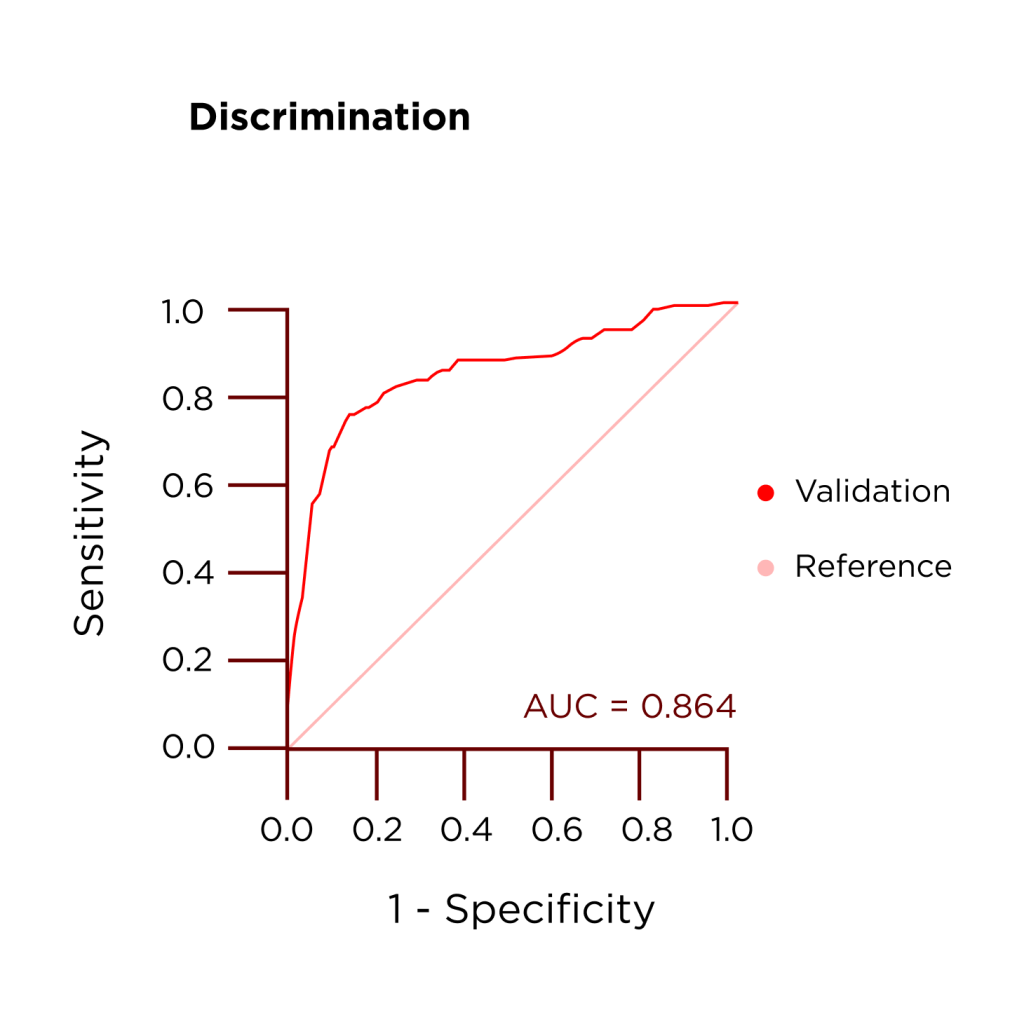
In the paper of Hewett et al. The author investigates a relationship between external knee abduction moment and the risk of an ACL injury by using a drop jump test. As you can see in picture one, the test failed to differentiate between athletes who were injured and those who were not. The question is, where do you draw the line for high and low risk. If we put the cut off value closer to the right side of the x axis, we will have higher specificity and lower sensitivity, what means that we will have more true negatives, but we will still miss some athletes that can get injured. To minimize error here, we can use the receiver operating curve that maximizes both sensitivity and specificity of the data on how well a continuous variable performs as a binary classifier by dividing the athletes into two groups, high and low.
The phrase “correlation does not imply causation” means that just because two variables are associated or correlated with each other, it does not necessarily mean that one causes the other. In the case of hamstring injury studies, a correlation between hamstrings strength and the risk of injury may be observed, but there may be other factors that contribute to an athlete’s risk of injury as well.
While correlation can provide insights into possible relationships between variables, it is important to keep in mind that correlation alone cannot be used to make accurate predictions. There may be cases where athletes with high levels of hamstrings strength still sustain an injury, or athletes with low levels of hamstrings strength remain injury-free. This highlights the importance of considering multiple factors when predicting injury risk.
Therefore, it is crucial to use a combination of variables and factors to make accurate predictions rather than relying solely on correlations. By considering multiple variables and factors, we can better understand the complex relationships that contribute to injury risk and make more informed decisions to prevent injuries.
Authors comment
As a fitness coach, I was initially convinced that postural and screening analyses could help me predict injuries in my athletes. I performed hundreds of tests, including the Thomas test, squat test, active leg raise test, and bird dog test, amongst others, believing that poor performance on these tests would indicate a higher risk of injury. However, through years of experience, I learned that predicting injuries is much more complex than simply performing these tests.
While these tests can provide valuable information, they are just one piece of the puzzle when it comes to injury prevention. The injury risk is influenced by many factors, including biomechanics, previous injury history, age, training load, and genetics. It is difficult to predict injury risk based on a single factor, and even advanced technologies and algorithms used by machine learning methods can struggle to provide accurate predictions.
Despite these challenges, postural and screening analyses can still be useful tools for coaches and trainers. By identifying areas of weakness or limitation, coaches can design specific exercises or corrective strategies to address these issues and reduce the risk of injury. However, it is important to approach these tests with a critical eye and not rely on them as the sole predictor of injury risk.
Ultimately, a comprehensive injury prevention program should consider all relevant factors and provide a well-rounded approach to injury prevention. This may include a combination of strength training, mobility work, neuromuscular training, and other strategies to address individual needs and reduce injury risk. By using a holistic approach to injury prevention, coaches and trainers can help their athletes perform at their best while minimizing the risk of injury.
References:
- Bahr R. (2016) Why screening test to predict injury do not work-and probably never will…a critical review, Br. J Spors Med, 50(13),776-780
- Jo Clubb, Football Science Institute, master football reconditioning coach course