A few weeks ago, the VALD Performance system sent us their three pieces of equipment: Forcedecks, Force Frame, and NordBord. Expressing our gratitude to Sebastjan Potokar, Scott Vallace, and their entire support team is essential. They have been prompt and helpful in addressing our questions and providing technical support, which was crucial for us in the beginning. Following our familiarization with the equipment, we proactively reached out to several clubs, offering them the opportunity to test their players. I was particularly interested in the condition of Croatian clubs and the information we would gather from the equipment.
The Testing Procedure
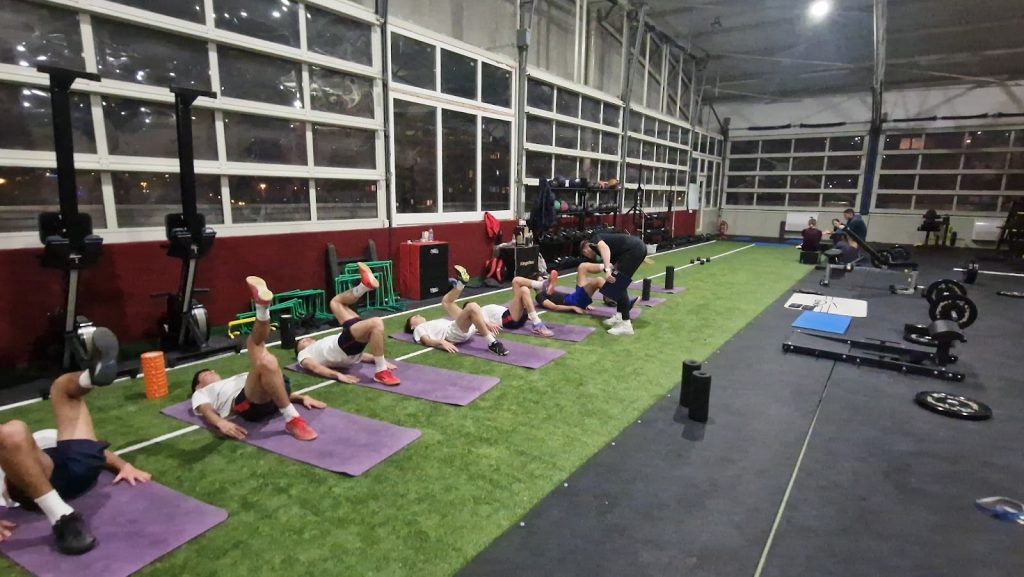
The testing was conducted on a sample of soccer players aged 14 to 17, comprising players from the junior, cadet, and pioneer age groups. The testing occurred at the end of the competitive period from December 17th to 19th, 2023, marking the last week of the season. On that day, players did not follow their usual club schedule, and we requested the club to minimize activities to ensure optimal conditions for testing. The testing spanned three days, with two evening sessions at 6:00 PM and one morning session at 9:30 AM.
I acknowledge that the conditions were not conventionally standardized as taught in academia, but there was no alternative. It was a choice between conducting the testing now or not at all. Later on, you will see that the information we gathered was well worth the decision to conduct the testing in this manner.
Warm-up
The warm-up protocol lasted 10-15 minutes and included several fundamental elements:
- Temperature elevation through 3 minutes of jogging.
- Myofascial release with a foam roller and individual preparations based on recent activities for 3 minutes.
- Mobility complex (each activity for 20 seconds): knee extension, hip flexion, hip rotations, book opener, split stance triple position, short and long adductors
- Activation exercises: front plank 3×10 seconds, side plank from the knees 2×30 seconds, bridge holds 2×20 seconds, single-leg bridge 2×6/6, fast squat 5x, fast forward lunge partial ROM 5/5, tall to short drops 5x
After the traditional warm-up, we proceeded with the specific warm-up tailored for testing on the systems.
The NordBord Testing Protocol
The NordBord was developed by prominent sports science researchers Dr. Tony Shield and Dr. David Opar, who subsequently published groundbreaking findings from various cohorts, including Australian Rules Football, Soccer, and Rugby. These findings have revolutionized how elite sporting organizations comprehend, manage, and rehabilitate hamstring strain injuries.
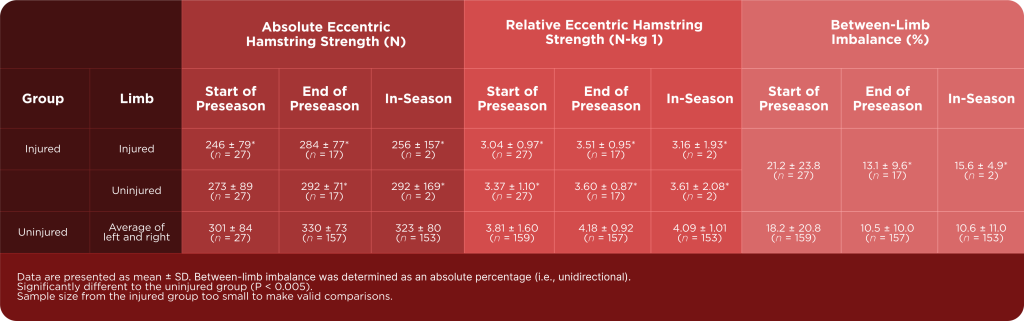
A study conducted by Opar et al. (2015) delves into the critical factors influencing hamstring strain injuries (HSI) in elite Australian footballers, providing insights into potential preventive measures. The primary objective of this research was to unravel the relationship between eccentric hamstring strength, between-limb strength imbalance (measured during the Nordic hamstring exercise), and the likelihood of hamstring strain injuries.
The study, involving 210 elite athletes from five different teams, aimed to identify key indicators that could help predict and mitigate the risk of HSIs. Over the observation period, 28 new cases of hamstring strain injuries were recorded. Importantly, athletes with lower eccentric hamstring strength faced a significantly higher risk of future HSIs. This research has had a significant impact on understanding and addressing hamstring injuries in elite sports.
Specifically, the study found that eccentric hamstring strength below 256 N at the start of the preseason increased the risk by 2.7-fold, while a strength level below 279 N at the end of the preseason raised the risk by 4.3-fold.
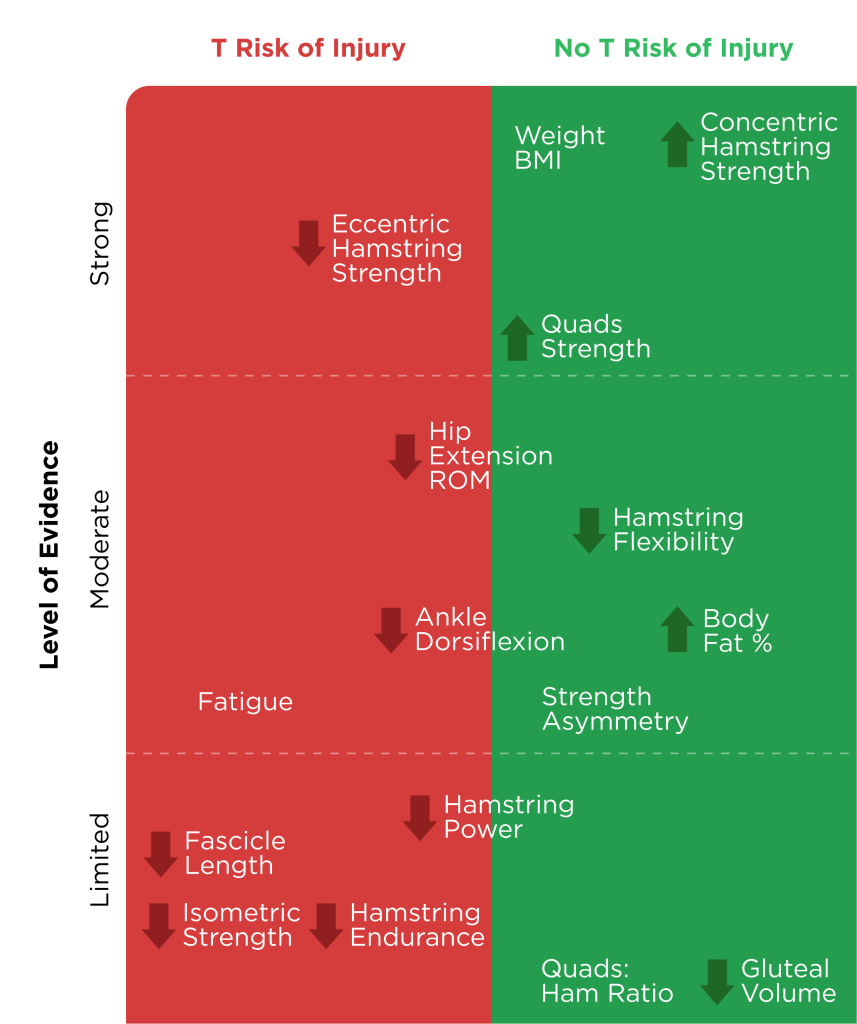
Eccentric Strength as the Key Predictor
Interestingly, the analysis did not establish a higher risk for future hamstring strain injuries (HSIs) in athletes who had previously sustained lower limb injuries within the last 12 months. Instead, the key predictor was identified as eccentric hamstring strength. The motivation behind testing this muscle group in an eccentric contraction type was primarily driven by one specific research study.
Moreover, those of us involved in soccer are well aware that hamstring injuries are among the most common in the sport, and their frequency does not seem to decrease. If you’ve read our previous blogs (such as this one), you know that a single parameter won’t predict whether someone will get injured or not, but it can provide guidance on where to look for potential patterns.
Testing Protocol and Results
Prior to the Nordic Hamstrings exercise test, we conducted three warm-up repetitions at 50-70% and 90% of player engagement, with 30-second rest intervals between repetitions.
Each athlete performed two or three repetitions. Those who had deviations in results greater than 5 to 8 percent compared to the previous repetition or whose execution technique was unsatisfactory performed three repetitions. Jo Clubb, a high-performance sports scientist, provides a detailed description of the testing protocol and the benefits of the test on her YouTube channel, The Performance Insight. For those interested in more information, I highly recommend it (Measure Hamstring Strength | VALD Performance NordBord).
It’s crucial to note that during the test, weaker players tend to perform the movement from the hip joint instead of the knee joint to compensate for their weakness. This observation was evident in the testing we conducted.
Insights from Injury History
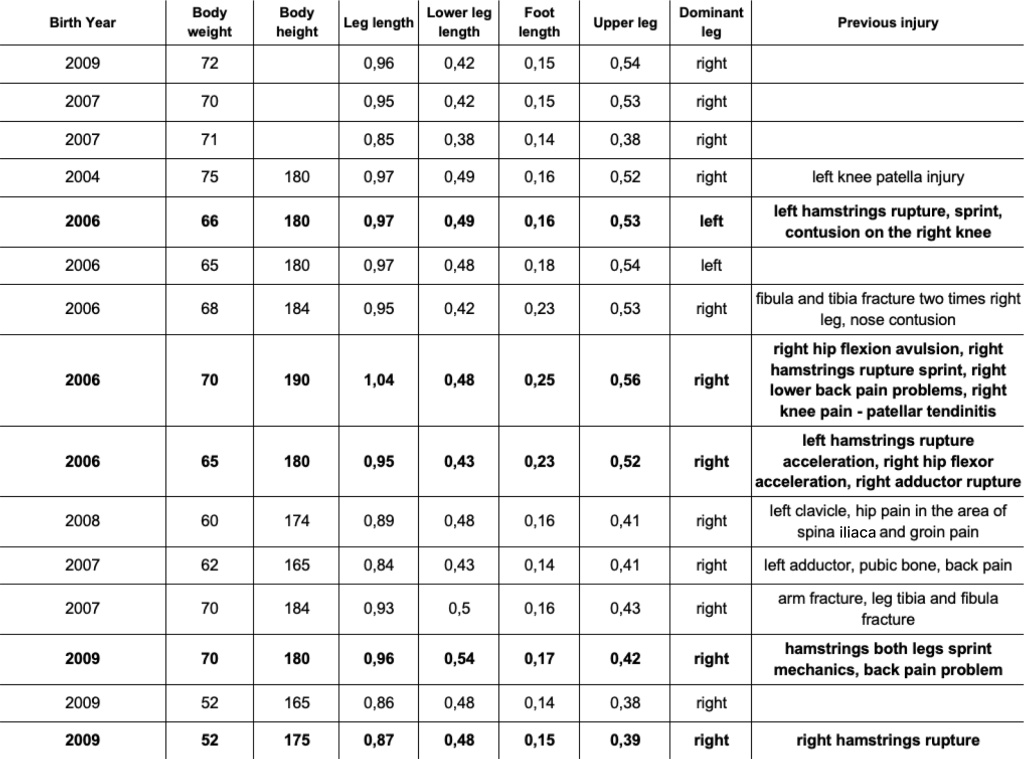
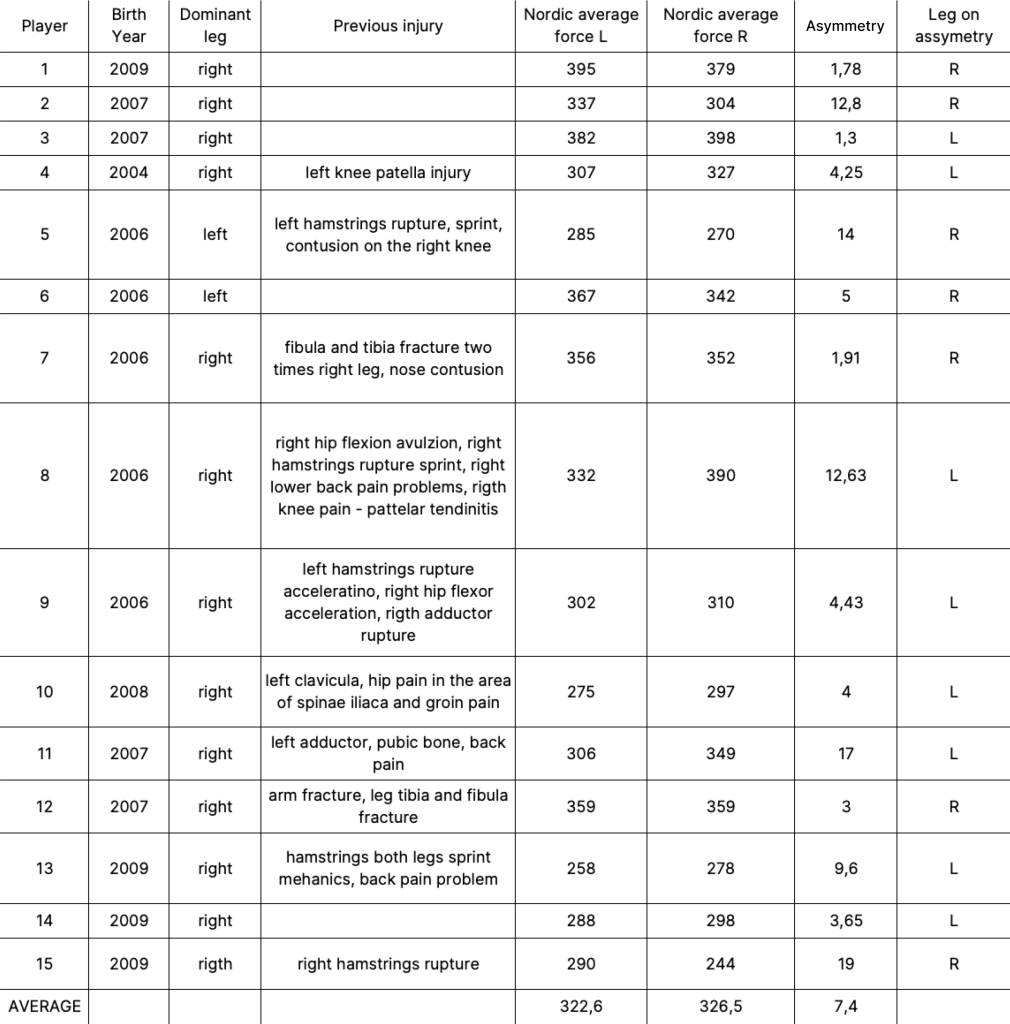
In addition to the actual values obtained from the testing, what immediately caught my attention is the injury history of this group. As seen in Table 1, out of the 15 participants, 10 had some previous injury throughout their careers. Among the 15 athletes, 5 had hamstring injuries, mostly occurring during acceleration or sprinting, and predominantly on their dominant leg.
Even without conducting the specific testing, armed with this information about their past injuries, as conditioning coaches, we can proactively design warm-up protocols for these players or create individualized recovery protocols. Apart from hamstring issues, lower back pain and adductor problems are also prevalent among a significant number of athletes in this group, in my opinion. Given that this group of participants has limited experience in neuromuscular training and mostly initiated some form of this training after the peak height velocity phase, it is evident that soccer has primarily served as their training stimulus.
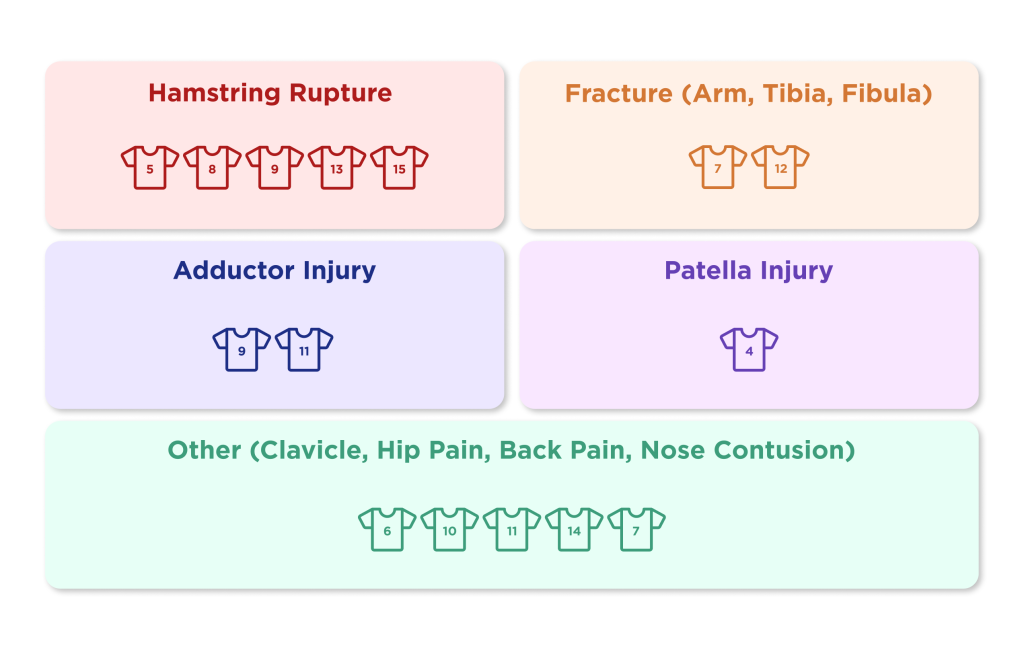
Analysis of Injury Distribution and Dominant Leg Prevalence
Dominant leg distribution:
- Hamstring rupture: 2 left, 3 right
- Fracture (arm, tibia, fibula): 1 right, 1 left
- Adductor injury: 2 left
- Patella injury: 1 left
- Other (clavicle, hip pain, back pain, nose contusion): 3 right, 1 left, 1 not specified
Injury distribution:
- Hamstring rupture: 33.33%
- Fracture (arm, tibia, fibula): 13.33%
- Adductor injury: 13.33%
- Patella injury: 6.67%
- Other (clavicle, hip pain, back pain, nose contusion): 33.33%
Dominant leg distribution:
- Left: 26.67%
- Right: 66.67%
- Not specified: 6.67%
The most frequent injuries are Hamstrings Rupture and Other (Clavicle, Hip Pain, Back Pain, Nose Contusion), both at 33.33%. Right dominant legs are slightly more prevalent (46.67%) than left dominant legs (26.67%). The distribution of injuries across dominant legs varies, with no clear dominance in one leg for all types of injuries.
This is not just another blog or text where we expect to find someone to blame for the current situation or discuss why certain things should not be done. The goal is simply to raise awareness that something needs to change. Moreover, for changes of this kind, you don’t necessarily need financial resources, and sometimes not even too many material conditions – just a good idea and an answer to the question of why we are doing something. When examining injury prediction research, previous injuries typically emerge as a crucial factor that needs attention (I know we’ve been repetitive with this, and we should be aware of it by now, I suppose :D).
Now, imagine the scenario: a previous injury, as some of these players from the testing have, the beginning of the preparatory period, low load in the transitional period, moderate strength levels, and a sudden increase in load during the preparatory period = a ticking time bomb.
What we also often forget is that injuries of this nature do not necessarily occur in the week we applied the stress but may manifest later.
What Data Says
The average absolute force value for the entire group of soccer players, calculated by averaging the Nordic average force values for both left and right legs, is approximately 324.55.
The calculated average force values for the Nordic hamstring curls reveal interesting insights into the strength distribution between the left and right legs among the group of soccer players. The average force for the left leg is approximately 339.067, while the average force for the right leg is approximately 329.467.
For the 2004-born player (Player 4), the Nordic force values stand at 307 for the left leg and 327 for the right leg. Despite a previous left knee patella injury, these values suggest a resilient recovery, showcasing robust strength levels when we compare the data with the article above.
Average Force Values Across Age Groups
In the 2006 cohort (Players 5, 6, 7, 8, and 9), a spectrum of force values is observed. The average force for the left leg is approximately 328.4, with a range from 302 to 367. On the right leg, the average force is around 332.8, varying from 310 to 390. These variations highlight individual responses to training, injury management, and biomechanical differences.
For the 2007 age group (Players 2, 3, 11, and 12), the average force for the left leg is approximately 335.6, ranging from 304 to 382. On the right leg, the average force is about 332, with values ranging from 278 to 398. This group showcases diversity in strength, potentially influenced by training emphasis and injury histories.
Player 10, born in 2008, exhibits average force values of 275 for the left leg and 297 for the right leg. These values, while representing a slightly lower range, provide insight into the unique strength characteristics within this age group.
For the 2009 age group (consisting of Players 1, 13, 14, and 15), the average force for the left leg is approximately 307.75, with values ranging from 258 to 395. On the right leg, the average force is around 299.75, varying from 244 to 379. Consequently, these results underscore the diversity in training regimens and individual responses among the participants.
The 2007 age group emerges with the highest values, signifying a potentially elevated overall strength level within this cohort. The 2006 age group closely follows, showcasing robust force values.
Interestingly, the 2009 age group demonstrates comparable force values to the 2004 age group, indicating a level of consistency in strength development.
However, the 2008 age group exhibits slightly lower force values compared to others, suggesting potential differences in training emphasis or individual responses to conditioning.
Influence of Hamstring Injuries on Nordic Strength
In each case, the Nordic average force values on the injured leg consistently appear lower than those on the healthy leg for players with a history of hamstring injuries. This notable pattern suggests a potential influence of previous hamstring injuries on Nordic strength.
The asymmetry values, indicating imbalances between the left and right legs, tend to be higher for players with previous hamstrings injuries.
The lower Nordic force values on the injured leg may signify lingering effects of hamstring injuries, such as reduced muscle activation, altered biomechanics, or incomplete rehabilitation. The findings underscore the critical role of targeted rehabilitation and conditioning strategies for athletes with a history of hamstring injuries. While individual cases vary, the observed trend emphasizes the need for a nuanced approach to rehabilitation and conditioning, recognizing the enduring impact of injuries on athletic capabilities.
Wrapping It Up (For Now)
To present absolute values, we aimed to facilitate inter-group comparisons across age brackets and underscore the prevalence of previous injuries within this cohort. Practitioners can extrapolate average values for both the left and right legs in the Nordic test from the Croatian Football Academy season-end assessments. These data points serve as a valuable benchmark, offering practitioners a foundational reference for subsequent evaluations.
Furthermore, the VALD system, accessible through its HUB platform, provides age- and sport-specific benchmark values. This includes average benchmarks tailored for soccer athletes, enabling practitioners to contextualize and interpret their own findings against established standards. The majority of players in the study, specifically Players 5, 9, and 13, were below the 50th percentile for both left and right legs in terms of Nordic average force values. Player 15’s values were around the 50th percentile, while Player 8’s values were above the 50th percentile.
This suggests that, on average, the players in the study tended to exhibit Nordic force values below or around the median, indicating a potential area for improvement in Nordic strength relative to the provided percentiles.